
In the fast-paced world of online business and digital marketing, understanding user behavior is the key to unlocking the door of successful website optimization. This guide introduces you to the world of heatmaps—a powerful tool that provides insights into user interactions and helps you fine-tune your website for maximum engagement and conversions.
A company may have a beautiful website, but aesthetics are just the first step towards success. To truly stand out and succeed in the digital realm, you need to understand how users interact with your site. This is where the magic of heatmaps comes into play.
Table of Contents
The Importance of User Behavior Analysis
But why is understanding user behavior so important?
As we said, website optimization isn’t just about making your site look good; it’s about making it work effectively for your audience. Whether you’re running an e-commerce site, a blog, or a corporate webpage, the goal is to engage users, encourage them to take desired actions and keep them coming back for more. To achieve this, you need to delve deep into the minds of your users, understanding their behaviors, preferences, and pain points.
User behavior analysis allows you to see your website from the user’s perspective. It unveils valuable information like where users click the most, how far they scroll, what catches their attention, and where they might get frustrated and leave. Armed with this knowledge, you can make data-driven decisions to optimize your website and improve the user experience.
The Power of Heatmaps
Heatmaps are the unsung heroes of user behavior analysis. They are intuitive visual tools that provide a comprehensive view of how users interact with your website. Heatmaps take complex data and present it in a way that’s easy to understand, making them accessible to everyone from seasoned web developers to marketing novices.
In this comprehensive guide, we’ll explore the world of heatmaps in depth. We’ll uncover what they are, the various types available, the benefits they offer, how to use them effectively, and real-world examples of how businesses have leveraged heatmaps to supercharge their websites. So, let’s dive in!
Understanding Heatmaps
Before we dive into the intricacies of heatmaps, let’s start with the basics. What exactly are heatmaps in the context of web analytics?
What Are Heatmaps?
Heatmaps are graphical representations of data in which individual values are depicted as colors. In the realm of web analytics, heatmaps visually represent user activity on a webpage, turning raw data into a clear and actionable visual story.
How Do Heatmaps Work?
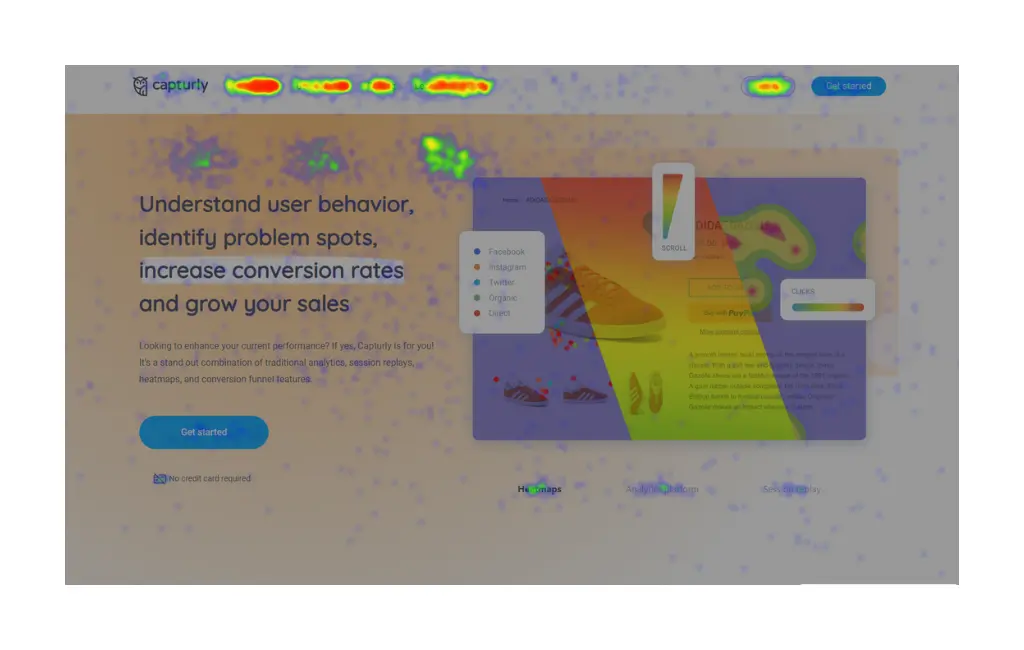
Imagine your website as a canvas and each user interaction as a brushstroke. Heatmaps collect data on these brushstrokes—where users click, move their cursor, scroll, and where they pay the most attention. This data is then translated into a visual heatmap, with colors indicating the intensity of user interactions. The hotter the color, the more user activity in that particular area.
Heatmap Beginner Guide
Learn more about heatmaps from the Basics to the Advanced Analytics
Read moreTypes of Heatmaps
Now that you understand the concept of heatmaps, let’s explore the different types available and how each can help you uncover valuable insights into user behavior.
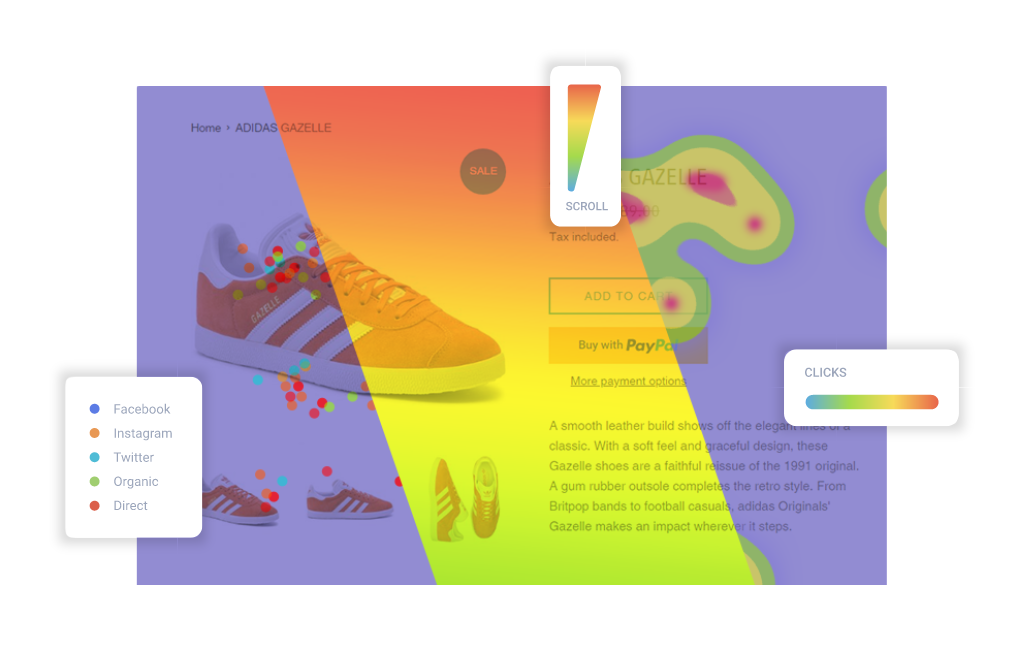
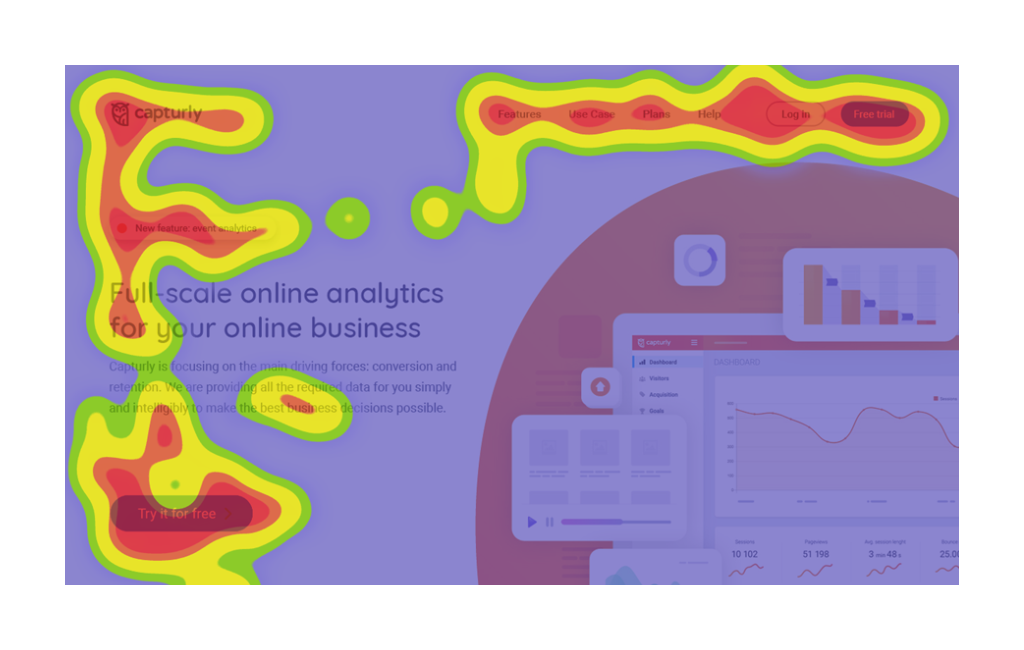
Click Heatmaps
Click heatmaps are like a treasure map, revealing where users are digging for gold on your website. They showcase which elements are getting the most attention and where users are clicking the most.
There are two primary benefits to click heatmaps:
✅ For one, they can help you pinpoint popular clickable elements on your site. This is gold when it comes to optimizing call-to-action buttons, links, and product images.
✅ On the flip side, they also reveal areas that users are ignoring. This information is invaluable for decluttering your site and focusing user attention where it matters most.
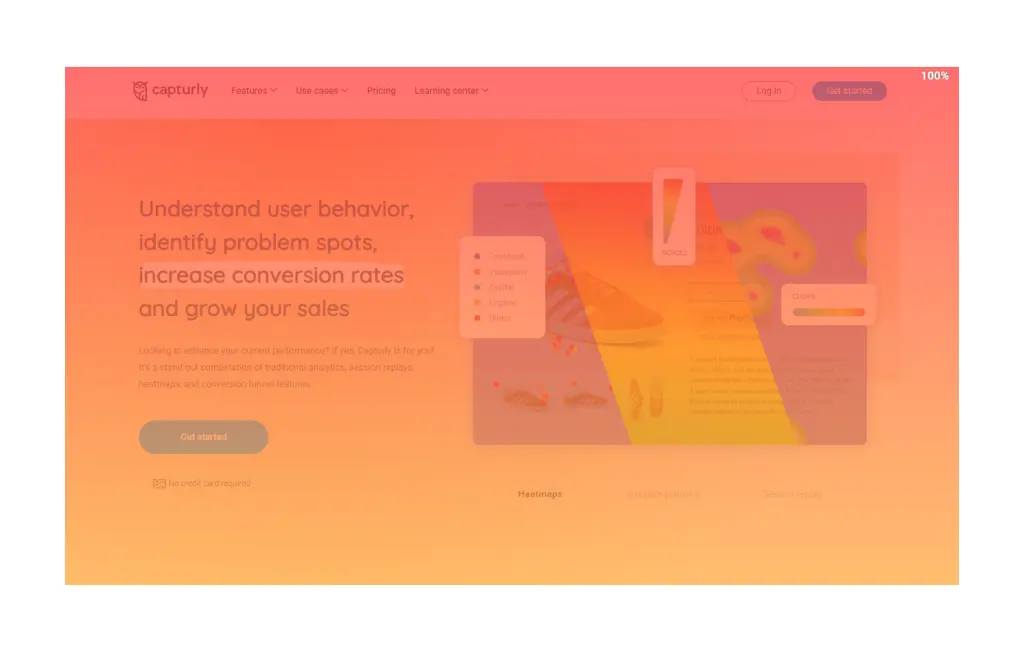
Scroll Heatmaps
Scroll heatmaps are like a GPS for user attention. They illustrate how far users scroll down a page and where their attention wanes.
These types of heatmaps can help you:
✅ Optimize Content Placement: By knowing where users usually drop off, you can strategically place crucial content, such as product descriptions or signup forms, where it’s most likely to be seen.
✅ Engage Users Effectively: Understanding user scrolling behavior allows you to structure your content to keep users engaged as they move down the page.
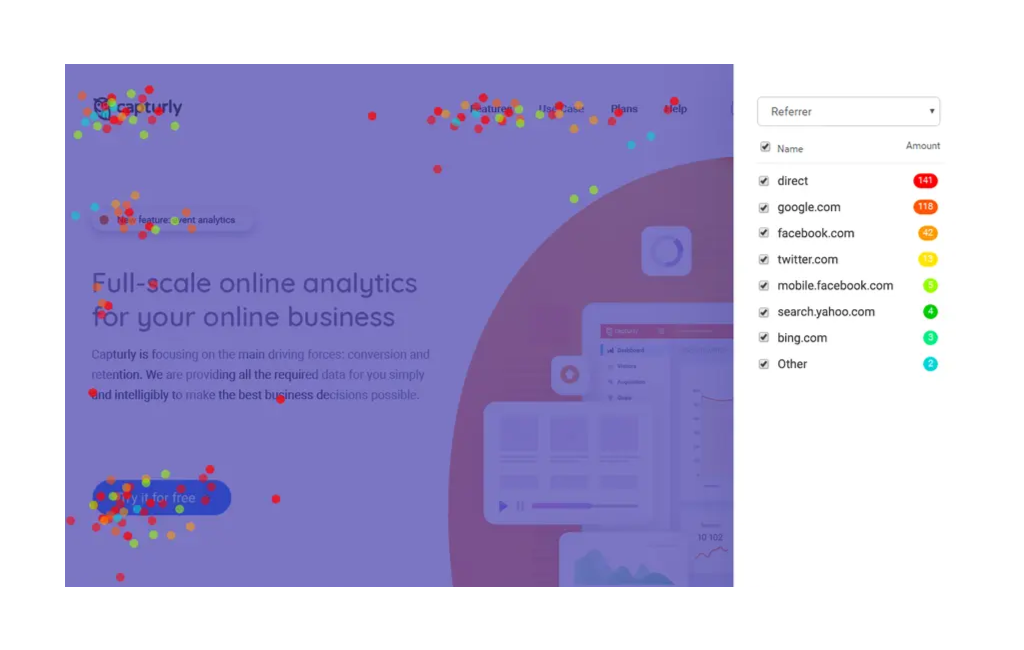
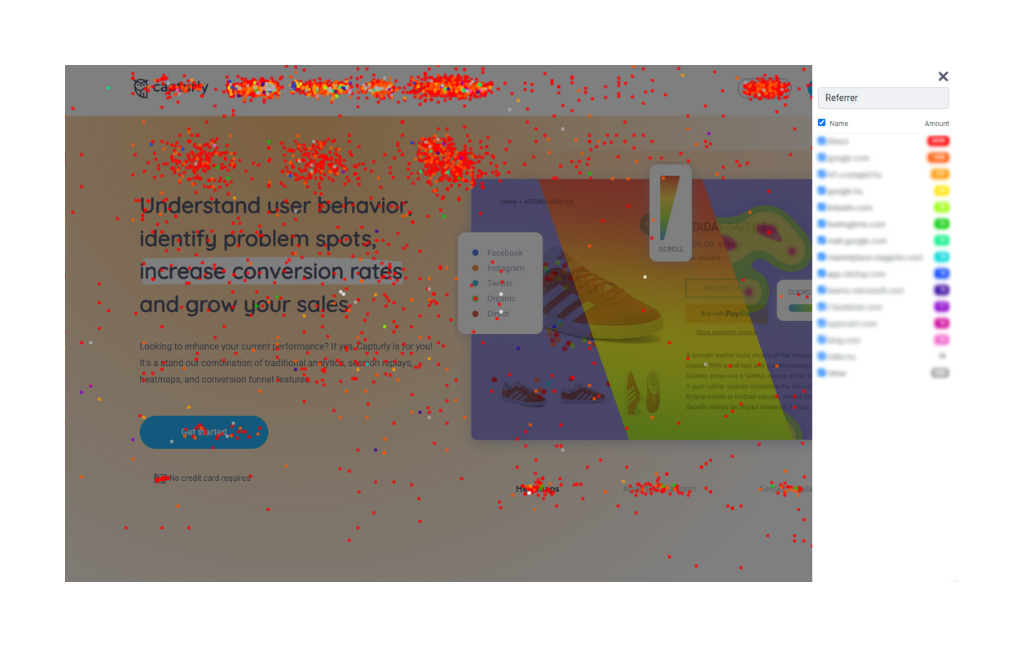
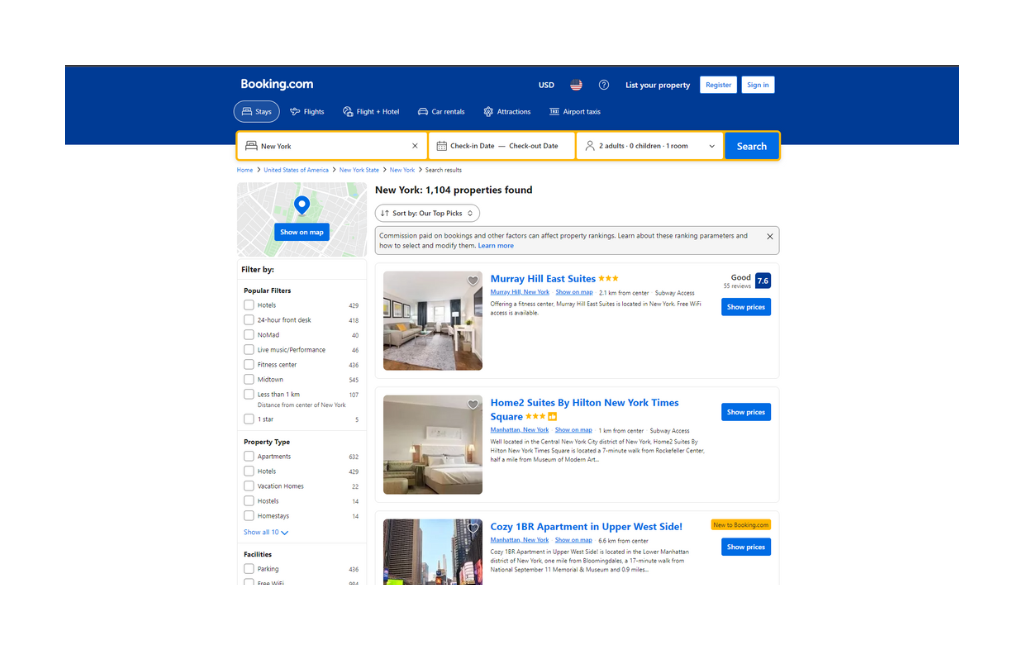
Segment Heatmaps
Segment Heatmaps are the gold pan of the endless river of your website’s traffic, helping you uncover hidden treasures. Like click heatmaps, they help you discover where different segmented users clicked and how they behave on your site.
But how can they help you?
✅ Compare user behavior across devices: They show you how users from different devices behave on your website, where they click and what interests them.
✅ Analyze different user search intents by traffic source: Users from different referrers may come to your site with different goals. Find out what their goal is and optimize your site to achieve it.
Movement Heatmaps
Ever wondered where users move their cursors and how they navigate your website? Movement heatmaps track these cursor journeys, providing insights into user engagement and hesitations.
The primary benefits of movement heatmaps are that they can:
✅ Spot Engagement Patterns: Analyzing cursor movement patterns can reveal where users are spending more time, indicating their interest.
✅ Identify User Confusion: If users move their cursors erratically or hover over non-clickable elements, it may signal confusion or frustration. This information can help you improve the user interface and experience.
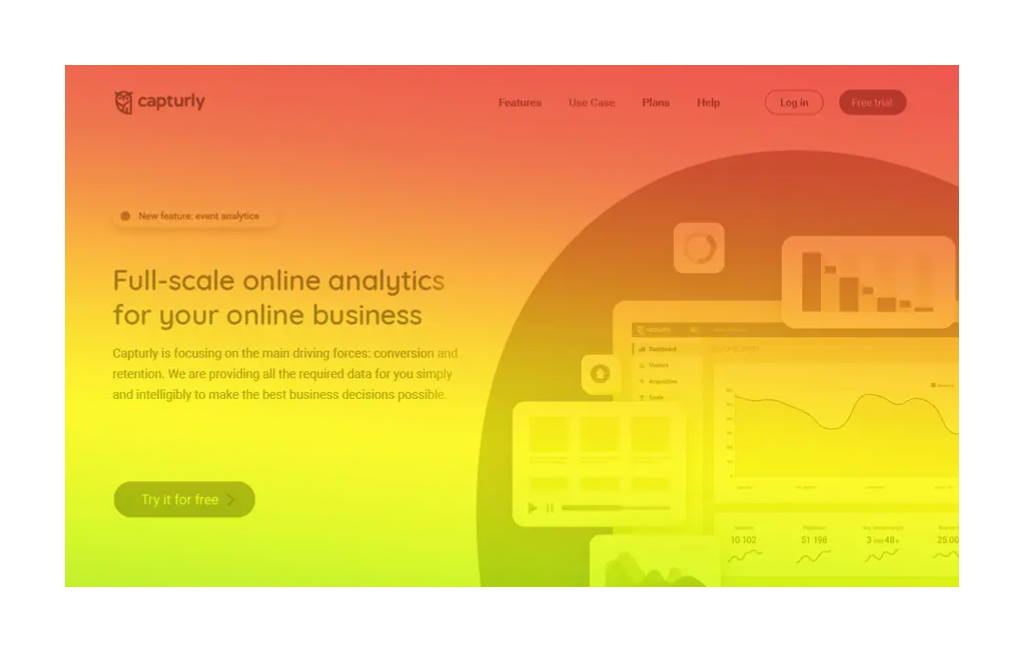
Attention Heatmaps
Attention heatmaps are like a spotlight on your webpage, revealing where users focus their gaze the most. They help you understand what grabs user attention and what might be overlooked.
The benefits of attention heatmaps are that they can:
✅ Enhance Website Layout: By knowing where users are looking, you can optimize your website’s layout and digital design to align with these attention hotspots.
✅ Design Effective Advertisements: For advertisers, attention heatmaps can be a goldmine for designing effective banner ads or promotional content that captures users’ attention.
Benefits of Using Heatmaps for Website Optimization
Now that we’ve explored the types of heatmaps, let’s dive into the tangible benefits they offer for website optimization.
Identifying User Patterns
Understanding user behavior patterns is like having a secret key to unlock your website’s potential. Heatmaps enable you to uncover common behaviors and preferences among your users.
You can utilize user behavior patterns to optimize:
Content Strategy
Discover which types of content users prefer and tailor your content strategy accordingly. For instance, if your videos are getting lots of attention and clicks but your blog posts aren’t, it might be time to switch up your blog strategy and increase the number of videos you put out.
Navigation Enhancement
Heatmaps help improve website navigation by identifying common user navigation paths to improve the accessibility of key pages.
- Personalization: Leverage user behavior data to offer personalized recommendations and experiences.
Improving User Experience (UX)
User experience is at the heart of website optimization. Heatmaps act as a magnifying glass, helping you identify pain points and frustrations users may encounter.
Enhancing UX with Heatmaps
- Spotting Frustration Points: Identify where users might be getting frustrated or experiencing difficulty in navigation.
- A/B Testing: Use heatmap data to inform A/B tests aimed at enhancing the user experience.
- Mobile Optimization: Optimize your website for mobile users by understanding their interactions through mobile-specific heatmaps.
Conversion Rate Optimization (CRO)
For businesses, conversion rates are often the ultimate goal. Heatmaps can help improve conversion rates by pinpointing where users drop off in the conversion funnel.
They can help you increase your conversions by:
- Identify Bottlenecks: Find the specific pages or elements causing drop-offs in your conversion funnel.
- Form Optimization: Optimize forms and checkout processes based on user interactions, reducing abandonment rates.
- Call-to-Action Optimization: Maximize the effectiveness of your CTAs by placing them where users are most likely to engage.
How to Use Heatmaps Effectively
Now that you understand the benefits of using heatmaps, let’s delve into how to harness their power effectively.
Setting Up Heatmap Tracking
Before you can start benefiting from heatmaps, you need to set up tracking on your website.
Choosing a Heatmap Tool
There’s a plethora of heatmap tools available, each with its own set of features and capabilities. First of all, I recommend Capturly, which offers click, scroll and segment heatmaps, as well as other game-changing features for free to improve your website. But there are other options, such as Crazy Egg, Hotjar, or Mouseflow.
Here are a few factors to consider when choosing a heatmap tool:
- User Interface: Ensure that the tool’s user interface is user-friendly and suits your team’s skills.
- Data Visualization: Evaluate the quality of data visualization provided by the tool.
- Pricing: Consider your budget and choose a tool that offers the features you need within your price range.
Implementing Heatmap Tracking Code
Once you’ve chosen a heatmap tool, the next step is to implement the tracking code on your website. This code is what enables the tool to collect data on user interactions.
Here’s how to ensure optimal data collection with any heatmap tool:
- Step-by-Step Guide: Follow the tool’s provided instructions for adding the tracking code to your website.
- Testing Across Pages: Ensure that the tracking code is correctly implemented on all relevant pages to gather comprehensive data.
Capturly Tracking Code
Analyzing Heatmap Data
Now that your heatmap tool is up and running, it’s time to start analyzing the data it provides.
Interpreting Click Heatmaps
Click heatmaps are your first stop in understanding user behavior. They show you where users are clicking the most, highlighting clickable elements’ popularity.
- Optimizing Clickable Elements: Heatmaps provide visual insights into user interactions, allowing businesses to analyze and optimize clickable elements on their websites or apps based on where users engage the most.
- Click Density Analysis: Analyze click density to identify the most popular areas of your website.
- Improving Underperforming Elements: Pinpoint underperforming clickable elements and optimize them to increase engagement and conversions.
Extracting Insights from Scroll Heatmaps
Scroll heatmaps tell the story of user engagement. As we’ve already talked about, they show how far users scroll down your pages and where their interest wanes.
- Understanding scroll depth: Use scroll-depth distribution to strategically place content where it’s most likely to capture user attention.
- Content Length Optimization: Adjust content length based on user scrolling behavior to ensure they receive key information.
Uncovering Segmented Patterns and Attention Zones
Segment heatmaps are like your website’s body language, revealing where segmented users are looking and how they navigate.
- Design and Content Tailoring: Reveal segmented user behavior patterns to make informed decisions about layout, placement, and content adjustments to enhance the user experience and drive engagement.
- Attention Hotspots: Use attention hotspots to tailor your content and design to align with segmented user behavior.
Real-World Examples of Heatmap-Driven Optimization
To illustrate the real impact of heatmap-driven optimization, let’s explore scenarios in which businesses leveraged heatmaps to supercharge their websites.
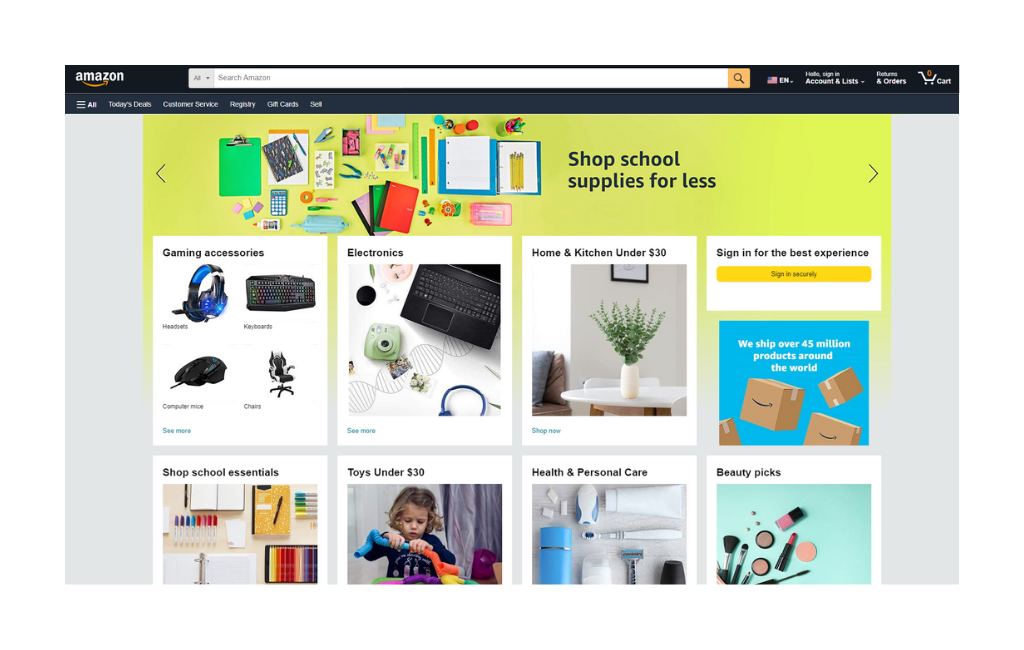
E-Commerce Website
Imagine an e-commerce website selling a wide range of products. They implemented heatmaps to gain insights into user behavior.
- Product Visibility: By analyzing click heatmaps, they identified which product categories were the most popular. They prominently showcased these categories, resulting in increased product visibility.
- Optimized Product Pages: Insights from both movement and click heatmaps led to strategic optimization of product pages. They placed key information and calls to action where users were most engaged, resulting in higher conversion rates and increased sales.
Blog or Content Website
Consider a content-heavy blog that struggled with high bounce rates. They turned to heatmaps to understand user engagement.
- Content Readability: Scroll and attention heatmaps revealed that users were often abandoning articles midway. They restructured their articles to improve readability, leading to reduced bounce rates.
- Enhanced User Engagement: Heatmap data allowed them to fine-tune content placement, keeping users engaged and increasing the average time spent on their pages.
Best Practices for Heatmap Analysis
While heatmaps are powerful tools, it’s essential to use them effectively to drive lasting optimization benefits.
Consistent Tracking and Analysis
- Continuous Monitoring: Heatmap analysis should be an ongoing process. Consistently track user behavior to stay ahead of changing trends and preferences.
- You should also avoid one-time analyses: Don’t treat heatmap analysis as a one-time task. User behavior evolves, so make it a routine to ensure lasting optimization benefits.
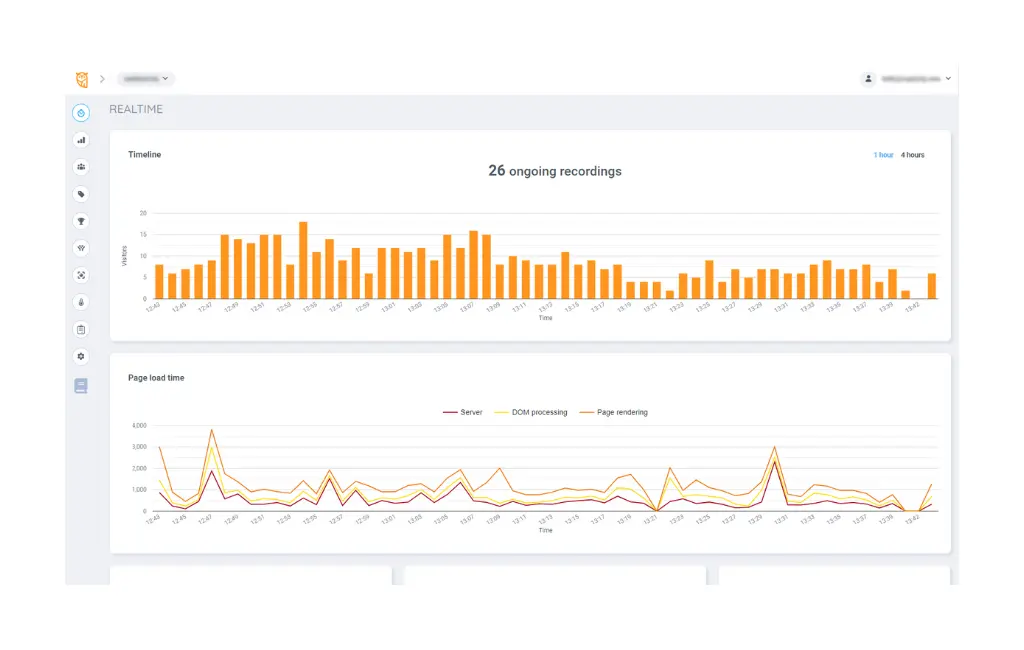
Combining Heatmap Data with Other Analytics
For a more comprehensive understanding of user behavior, integrate heatmap insights with data from other sources, such as Capturly’s Session Recording or Conversion Funnel.
- Holistic Understanding: Combining data sources paints a more complete picture of how users interact with your website. Use this holistic understanding to inform your optimization strategies effectively.
Conclusion
In the fast-paced world of online business, understanding user behavior is your secret weapon for success. Heatmaps are more than just colorful visuals—they’re your ticket to unlocking the mysteries of user behavior. Armed with the insights gleaned from click, scroll, movement, and attention heatmaps, you’re equipped to optimize your website for a seamless user experience, improved conversions, and overall enhanced performance.
So, dive into the world of heatmaps and witness the transformation in user engagement and business success. The journey begins with understanding your users and making data-driven decisions to create a website that caters to their needs and preferences. With heatmaps as your guide, the path to website optimization becomes clearer and more rewarding than ever before. Start leveraging heatmaps today, and let your website reach new heights of success.
4 Comments
mario games
2023-10-25 at 04:03This is an amazing and informative article that covers so much ground.
tunnel rush
2023-11-15 at 10:49What you share is really helpful. It helped me a lot when creating my website.
basketball stars
2023-12-05 at 02:17Excellent article, thank you immensely. The use of wireframes is greatly elucidated.
geometry dash online
2024-01-31 at 04:43I think this will be a useful utility for users