
Understanding user engagement is crucial for online shops. Why? In short, extensive research has been done on loyal customers over the years. According to a study, you have a 60% to 70% chance of convincing loyal customers to buy from you again, while the average retention rate of new potential buyers is 13%.
Another study highlights that the cost of convincing a new buyer is five times higher than the cost of a potential buyer to retain a loyal customer. Marketing campaigns can effectively target loyal customers who are not only inclined to spend more but also provide your online store with a stable foundation for growth, allowing you to explore and conquer new markets.
Plus, having loyal buyers makes your overall revenue more predictable, making it easier to prepare for the future and save for tough times. But brand loyalty is a long-term process, especially when there are so many competitors competing for the attention and resources of potential customers.
Loyal buyers associate their chosen brand with superior quality and better service than competitors. Although there are a bunch of other marketing tactics, do not forget the most important thing: there’s no better advertisement than a high-quality product or service. However, keeping users engaged is harder than it sounds. It includes complex expressions and unfamiliar terms, all of which are essential to understanding its basic principles.
In this article, we’ve compiled the most important metrics you need to know and track regularly to collect as many loyal customers as possible.
Table of Contents
What is user engagement and why is it important?
First, let’s meet with user engagement and its relevance. Based on Useinsider’s definition: “User engagement or customer engagement is assessing an individual’s response to a digital offering: a service, a product or a website.”
It can reveal how users interact with your site, identify areas that you can improve, both positive and negative attitudes the customers have in mind, and much more. With the help of user engagement metrics, you can also establish better marketing strategies, which we can also identify as a positive impact.
What are user engagement metrics?
Even though you can get some stats without using analytics tools, your options are limited. You won’t know if your goals are successful, understand user behavior deeply, or find ways to optimize your site. That’s why you need analytics tools!
The two types of analytics tools
There are two types of analytics tools that you can use throughout your journey.
- quantitative tools: provide numerical data
- qualitative tools: provide data that cannot be expressed in numerical form
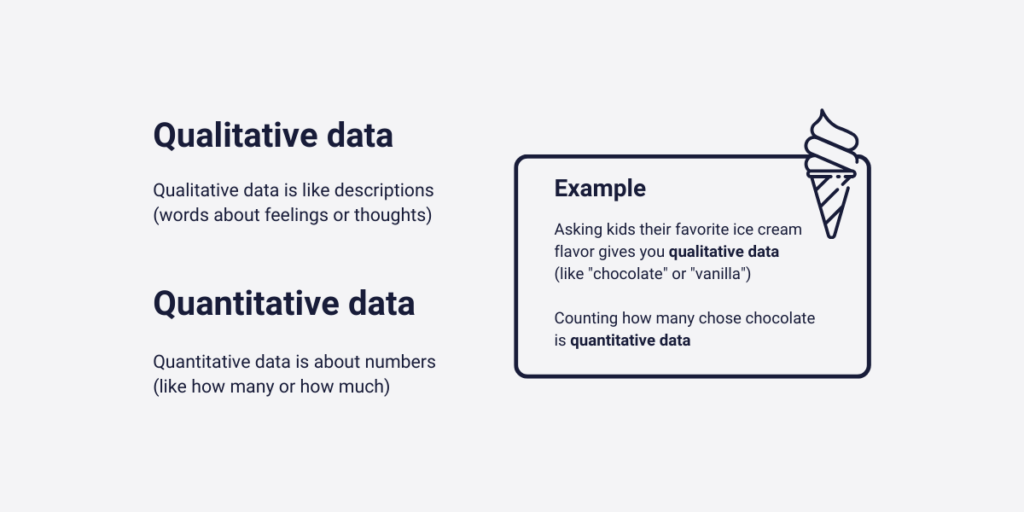
1. Quantitative tools
Quantitative tools help you find issues but don’t uncover the whole problem. They answer the “what”-s, not the “why”-s. They’re handy when you already know a lot about your customers and understand the reasons behind negative trends, like a decrease in sales.
Google Analytics is one of the most popular quantitative data analytics tools, and due to its accessibility (the basic functions are free for everyone), the most used one as well. For quantitative data analytics, we bravely recommend you to Google’s software. But what if you haven’t really understood the why’-s as of now? Well, that’s not good, but only if you want to make wrong assumptions.
2. Qualitative tools
Imagine that you recognize that you have fewer sales than last month with the help of Google Analytics statistics. Without further notice, you may think that your prices are too expensive compared to your rival’s prices, and that’s why your clients switch your webshop to your competitor’s webshop to solve its problem. However, after you put the prices lower, you experience no change in general.
Why is it? In this case, with your qualitative analytics tool, you would figure out that most of your clients got stuck at one of your funnels, because of a bug. After you fix that tiny mistake, your customers will move back to your site in a matter of time. And wrong assumptions cost you too much most of the time. Way more than the premium subscriptions of one of these qualitative analytics tools which we usually refer to as “session recording tools”.

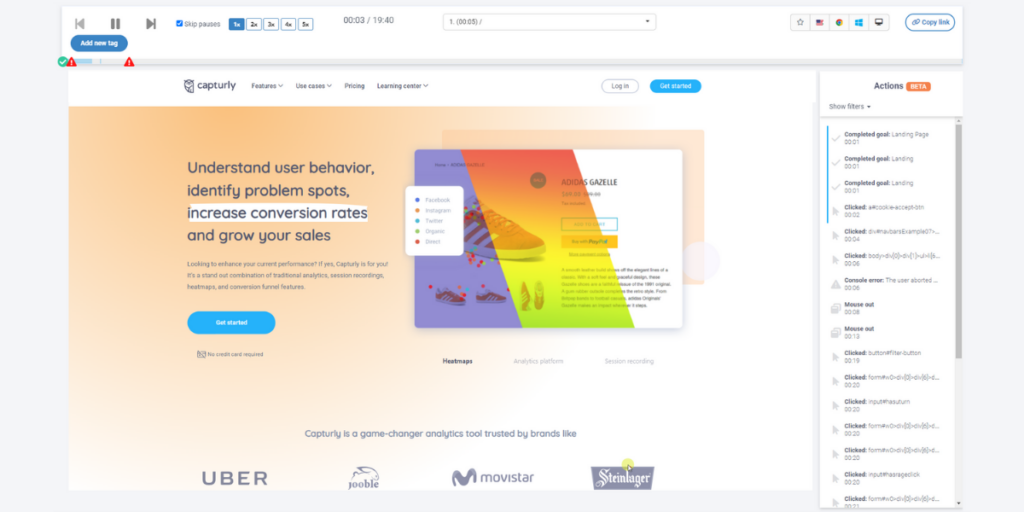
What are session recording tools?
Alongside their heatmap, and conversion funnel options (you will understand that later), you can analyze individual sessions with many qualitative analytics tools. These sessions are basically recordings of your user’s screens when they use your website. It is completely legal to make, store, and analyze this information after your users accept your terms and conditions.
Session recordings gather to you every click, scroll, and tap your customers made during their stay on your site. Moreover, it can indicate Javascript errors, U-turns (when your customers immediately come back from one place to another), and rage clicks. Or at least, most of the session recording analytics know these.
If you want to try one of the most in-depth session recording tools, we can recommend to you Capturly’s tool, which not only knows those functions that we mentioned earlier but there are a lot of other opportunities why you should choose our tool. A brand new survey function, in-depth filtering options, unique heatmap variations, and correct pricing; we can provide these all in one!
Top 5 user engagement metrics to track
What are the most important metrics? Well, it depends on what you really want to measure and what your goals are.
The literature distinguishes 4 different types of analytics goals from each other:
- Revenue types of goals
- Inquiry types of goals
- Engagement types of goals
- Acquisition types of goals
Different goals require tracking different user engagement metrics. However, some metrics are consistently relevant, no matter your current situation or future plans. This chapter focuses on these essential metrics. Let’s start with the first one!
1. Conversion rate
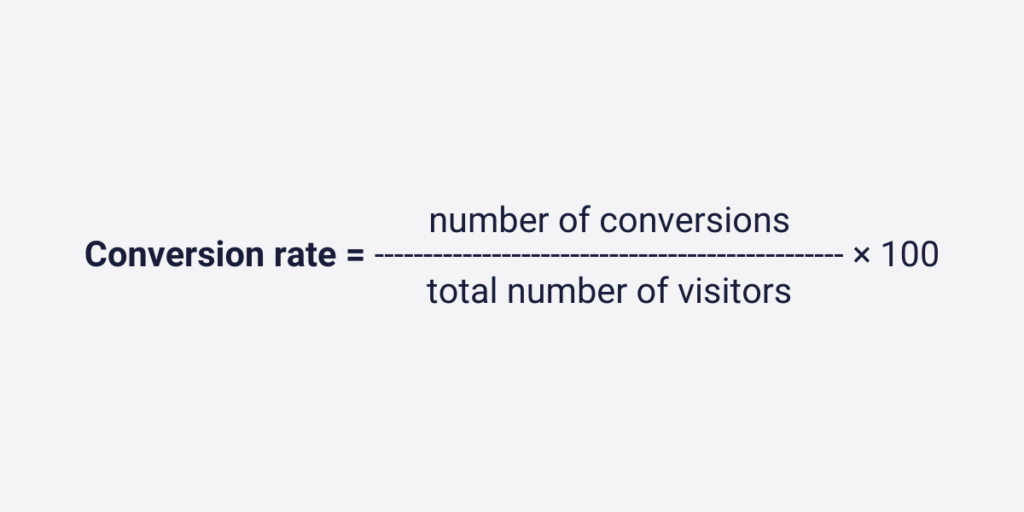
Let’s break down the basics of conversion rate. In the world of Ecommerce, defining your goals is a crucial first step. Goals can be various, such as clicking a button, making a purchase, or getting your customer’s email addresses. A conversion occurs when one of your customers completes a specific activity.
So if a customer “converts” they have done what you wanted. Conversion rate tells you what percentage of your total audience successfully converted. For example, if you have 100 visitors and your goal is to make a sale, and 10 customers complete a purchase, your conversion rate is 10/100 * 100 = 10%. Now, how do you know if your conversion rate is good? Average conversion rates vary in different industries, but generally, 10% or higher conversion rates are considered good.
Moreover, we wrote an article about different industries’ conversion rates. I recommend you to take a look and compare it to yours.
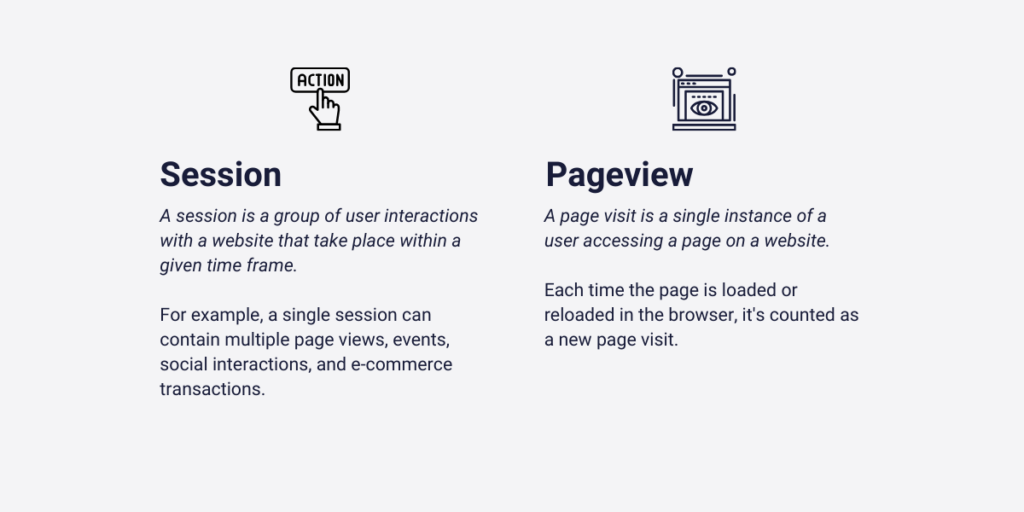
2. Pageviews
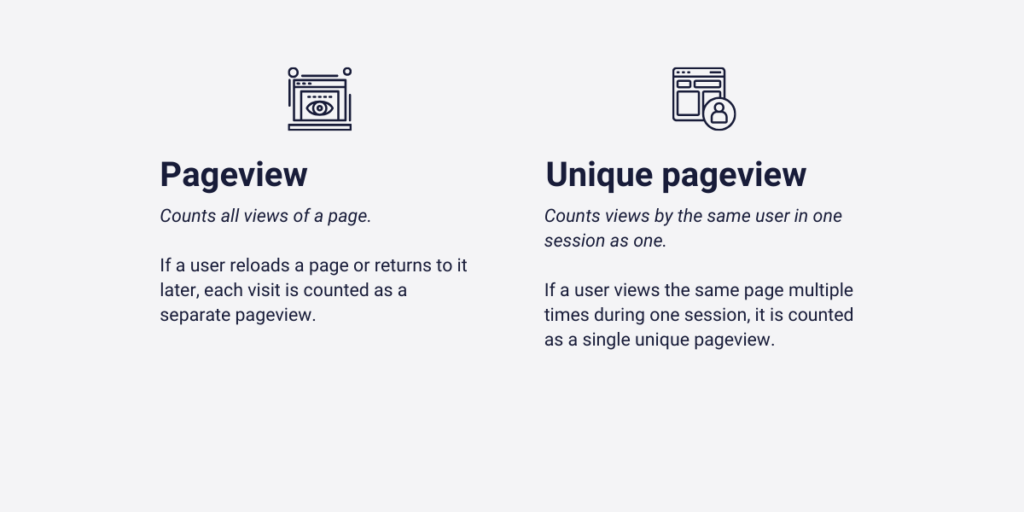
You’ve probably come across this term before, but let’s clarify it. A pageview is a request to load or reload your website. It counts when a user opens your site in their browser or refreshes the page during their visit (which ends after 30 minutes of inactivity).
Here’s the catch: the pageviews metric doesn’t tell you if it’s the user’s first visit, second, or third — it counts them all. Don’t draw conclusions based on this metric alone. A high number of page views does not automatically mean that your website is performing well. But when combined with other key metrics, it can provide valuable insights to better understand users.
3. Bounce rate
Bounce rate is one of the most crucial user-engagement metrics, but there are two types of explanation, so sometimes it’s hard to understand. One definition says that bounce rate is the percentage of visitors who exit your site even before taking action on it.
So these visitors don’t click on CTA-s, click on a link, fill out a form, and so on. The other definition is almost the same but tries to explain this phrase in another way. That said, bounce rate is the percentage of visitors who leave a website after reviewing only one webpage.
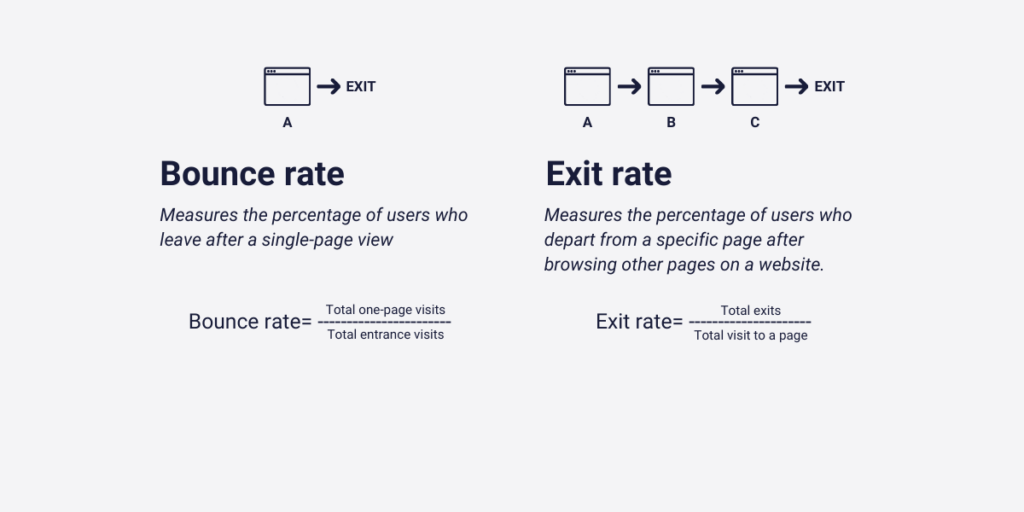
If you compare the two, you will see that the two activities are the same: bounce rate shows you those visitors whom you successfully directed to your webpage but were not satisfied with what they saw there.
Of course, there can be a couple of reasons for that behavior:
- they clicked accidentally (through an aggressive marketing campaign)
- they misunderstood what you sell, or the industry you are in
- these visitors are not satisfied with how your page looks like
Since bounce rate measures individual site’s statistics, you can extend tracking this metric in all of your sites, that way you can filter all of your subpages’ success. Although, it can mean a lot of things, if your site’s bounce rate is more than the industrial average, you need to improve a little.
That’s right! An average bounce rate is around 40-50%, but the industrial averages differ from that.
According to Customedialabs E-commerce websites have the lowest bounce rates, which is around 20-45%. On the other hand, a blog page’s bounce rate can move to 90%.
4. Average session duration
Let’s take a closer look at each session and explore what insights we can glean from them. Average session duration tells us the average time users spend on our site. The calculation is simple: add the duration of all available sessions and divide it by the number of visitors in a specific time period.
A longer average session duration generally indicates active engagement, unlike the opposite scenario. However, this procedure should not be used alone. For example, if the average session duration is long but the bounce rate is high, this may indicate a problem, such as a slow loading site.
5. Scroll depth
Maybe measuring scroll depth is not as important as measuring the last four user engagement metrics, but it is definitely a very interesting one that most of you haven’t even heard of. Generally scroll depth is a percentage ratio, which shows you how long your visitors scroll down at pages on average. As with everything else, this is also a numeral value, so the analytics tool that calculates this equation measures your page length first.
If the visitor scrolls down to the bottom of your page, it means the visitor went down to 100% of that page. Instead of percentages, some analytics tools track scroll depths in pixels, which is a little bit more confusing, but it can lead you to more accurate results.
The average scroll depth is around 57%, however it depends on the different types of pages. If one of your blog articles has a 57% scroll depth, you can feel a little disappointed. Here, you can think of your wrong writing style, inaccurate titles, or unreadable font styles as the source of the problem. But if your terms and services subpage has a 57% scroll depth, you have extraordinary skills. That’s why we can’t determine an average number that you must follow every time. Think of the circumstances when you rate your page’s success.
Conclusion
This article was all about opening a new door in the online world. Online analytics has grown to be one of the crucial elements of our online appearance. One of the biggest superpowers, when we want to sell something to customers, is to recognize what our potential buyers want from us, and how satisfied they are with our products, services, and all in all; our company and web appearance.
In this article, we took a look at the biggest data analytics tools and recognized what types of measurements they are specialized for. This will definitely help you to make a choice whether you need Google Analytics, or other data analytics, and session-recording tools. Most of the time, you need a combination of the two for maximum efficiency.
In the last chapter, we introduced you to the most common user engagement metrics: what do these metrics mean, how can you calculate them, what are the optimal averages, and whether you can make conclusions about the chosen individual metric, or not. If you read our article carefully you found all of the answers!
If you introduce analytics tools at your site, choose accurate goals beforehand, and the chosen metrics are in synergy with your designated goals, you will find yourself more prepared for your site’s audience. This is the most important key to introducing better and better-optimized websites, with perfect user experience!