A heatmap is an effective tool and technique that visualizes visitors’ interactions to gain insight into how users behave on a website, where they click, what they miss, and how far they scroll down.
In this article, you’ll find everything you need to know about heatmaps, starting from the basics to the advanced usage of heatmaps. We’ll guide you through how to create, read and analyze different types of heatmaps. You can also get information about their benefits and common use cases.
What is a heatmap?
A heatmap, also known as a heat map, is a data visualization tool and technique that displays data in two dimensions (2D) using different colors that vary according to its intensity. It allows readers to easily understand and process the information with the help of these obvious visual cues. The most common cases for using a heatmap are geographical data visualization and financial, business, or weather analysis.

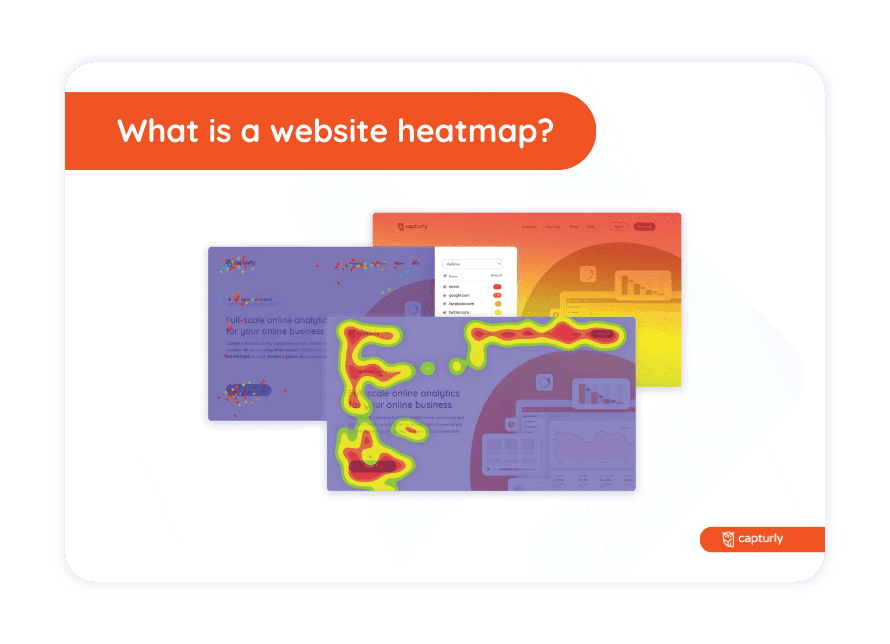
What is a website heatmap?
A website heatmap is a visual representation of user behavior on a webpage. It enables website owners to measure user interactions such as clicks, taps, and scrolls on their websites.
Each part of the website is marked with different colors, according to the attractiveness of that component. Usually, the most attractive zones are displayed in a ‘hot’ red color and the least attractive ones are in a ‘cold’ blue color. An attractive component or website element catches the attention of the visitors. Hence, users are more likely to click on the modules that are in the red areas.
So, with the help of heatmaps, it’s easier to rearrange the elements on your website. Important information can be noticed quickly when it’s put in the ‘hot’ colored area. While the ‘cold’ areas are good places for design elements or ads.
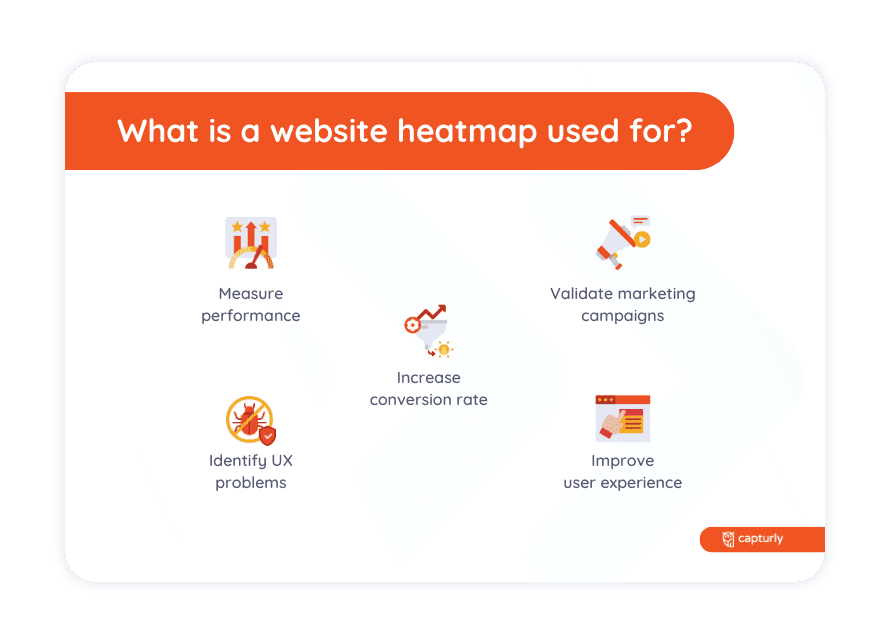
What is a website heatmap used for?
Heatmaps are a powerful tool for analyzing user behavior on a website and improving its conversion. Here are some ways they can be used:
- Measure performance: heatmaps are primarily used for measuring user behavior and awareness on a website. They help you define the best and worst performing parts of a webpage. It monitors the behavior of the visitors based on their interactions.
- Identify UX problems: Heatmaps can reveal UX problems that you might not have noticed before. For example, you might find that users are clicking on non-clickable elements or ignoring important calls-to-action.
- Improve user experience: using heatmap data, you can rearrange the website’s elements like images, buttons, and text according to the results of the heatmap study. Designing your website according to heatmaps can lead to a more user-friendly result, which can increase user satisfaction, since they can quickly and easily find the information they are looking for. Heatmaps reveal UX problems that you’ve never thought about before the analysis.
- Increase conversion rate: many e-commerce stores face the problem of low conversion rate. Maybe they have high traffic, but only a few conversions; or they just launched their store, and have some success, but don’t know what’s next. Heatmaps are also useful if you want to optimize the conversion rate on your website or conduct an A/B test and analyze and compare the results.
- Validate marketing campaigns: You can use heatmaps to validate the effectiveness of your marketing campaigns or landing pages. By tracking user behavior, you can determine whether your message is resonating with your audience and adjust your approach accordingly.
Discover user behavior on your website with our comprehensive tool that combines click, scroll, and segment website heatmaps!
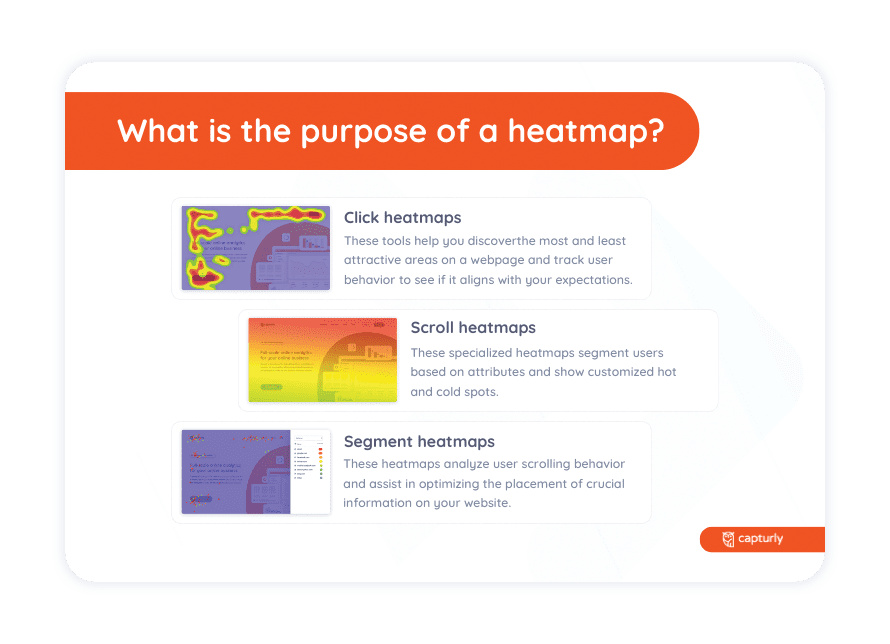
What is the purpose of a heatmap?
A heatmap is a powerful analytical and optimization tool that can help you improve user satisfaction, user experience, and conversion rate in a data-driven way. Why would you guess how your visitors browse your site when you can base the business decisions on real numbers?
Altogether, heatmaps give you further information about the consumer behavior on your website. Different types of heatmaps provide different types of information in connection with the interactions of your potential customers.
- Click heatmaps: these are good for getting to know the most and least attractive spots on a certain page. You can also check whether your visitors use your site as you expected or not.
- Scroll heatmaps: these help you to analyze how far users scroll on that page. These two types of heatmaps are useful when you’d like to find the right place for important information on your website.
- Segment heatmaps: these are a little bit different because they separate users into segments based on user attributes like new or returning customers or the referrers that lead the users to your website. These heatmaps show the ‘hot’ and ‘cold’ spots sorted by referrer sites. It can be suitable for you if you want to focus on a certain group of users. You can organize your website based on the preferences of your target group.
What does a heatmap show?
A heatmap shows the most and least attractive parts of your website since it represents user behavior. It uses different colors to display the catchiness of each part of the website.
The most interactive ones are marked with ‘hot’ colors, like red, and the least interactive ones with ‘cold’ colors, like blue or green. The ‘hot’ colors mean that users viewed and clicked that module the most. The ‘cold’ colors are the opposite of that as they symbolize the least exciting parts.

There are different types of heatmaps that allow you to measure different user interactions. Click heatmaps are based on the number of clicks on a specific part of the website. Scroll heatmaps show how far users scroll on a page. Segment heatmaps are good for identifying which referrer guides the most users to your website.
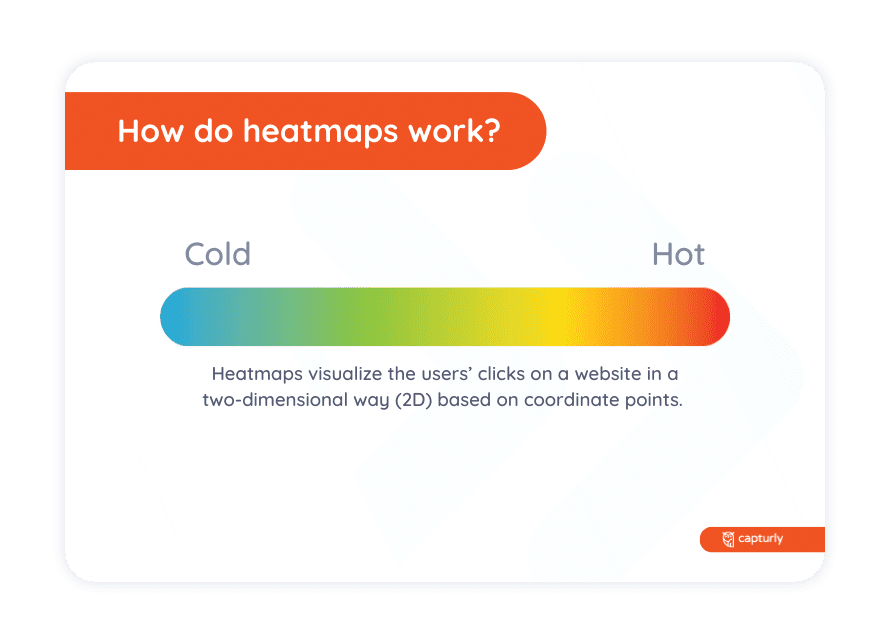
How do heatmaps work?
Heatmaps visualize the users’ clicks on a website in a two-dimensional way (2D) based on coordinate points. Click heatmaps display ‘hot’ and ‘cold’ areas, based on the number of clicks. They are useful to find the right place for each website element.
Scroll heatmaps reveal the most attractive part of your website depending on how far users scroll down. As the click heatmaps, scroll heatmaps use warm and cold colors too. Warm colors mean that a higher percentage of users scroll down to that section. While cold colored zones refer to leaving the website before reaching that part. They help you with positioning the sections vertically.
Segment heatmaps show the behavior of users grouped by different referrer sites. It analyzes the behavior of segments brought to that website by the same referrer. Each referrer has its color. Different colored dots appear on each part of the website, and they demonstrate the segments that clicked on those features.
Are there any free heatmap tools?
Capturly offers a free opportunity for heatmap analytics. What is more, it is available for an unlimited number of pages, so there is no limitation on the amount. The free version contains each type of heatmaps (click, scroll, and segment). Take a look: https://capturly.com/plans
Are heatmaps categorized as analytical tools?
Heatmaps are considered to be qualitative analytical tools. Behind the number of clicks, they contain lots of qualitative data like the spot, density, and source of the clicks. Heatmaps are visual representations that give deeper information about user behavior.