
As a website owner, one of your primary goals should be to create a website that not only looks good but also provides an excellent user experience (UX). A website with a great UX can increase the chances of conversions, decrease bounce rates, and help you build a loyal customer base. One tool that can help you achieve this goal is a heatmap. In this article, we will delve into what heatmaps are, their types, and how you can use them to improve your website’s UX.
Were you aware that visitors form an opinion about your website in just 50 milliseconds? That means you only have a 0.05-second opportunity to create a favorable first impression. It’s important to note that a positive first impression can be the deciding factor between visitors leaving and never returning or becoming long-term customers.
Table of Contents
What is a heatmap?
A heatmap is a graphical representation of data that uses colors to represent different values. In the context of a website, a heatmap can show you which areas of a page are getting the most attention from visitors. Heatmaps can help you understand how users interact with your website, what elements they click on, how far down the page they scroll, and how long they stay on your website.
A heatmap is a data visualization tool that uses color to represent different values, giving you a clear and concise view of how users interact with your website. The colors typically range from cool to warm (e.g., blue to red), with warmer colors indicating higher levels of user activity or engagement.
Heatmaps can provide you with valuable insights that can help you optimize your website for better UX. For instance, if you notice that a certain element on your website is not getting much attention, you can move it to a more prominent location to increase visibility.
Types of Heatmaps
There are different types of heatmaps, each with its own unique way of representing data. The three main types of heatmaps are:
Click heatmaps
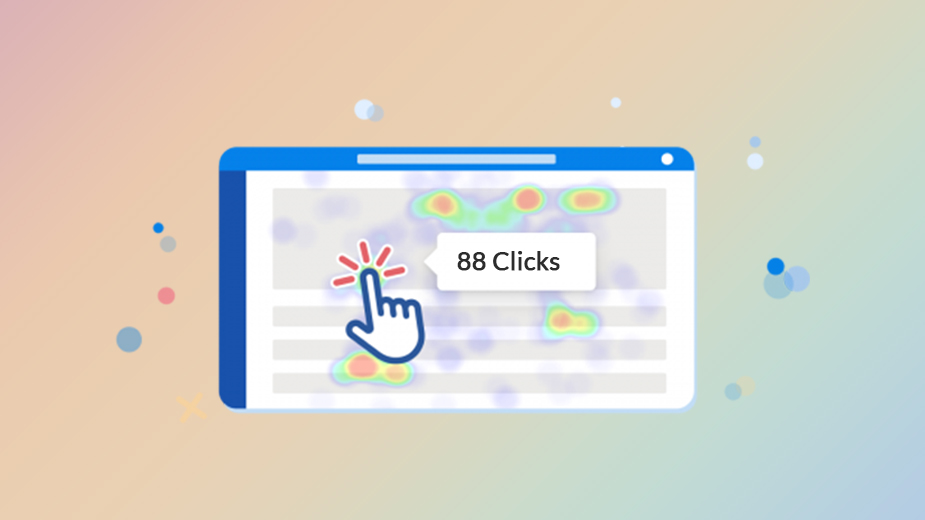
Click heatmaps show you which areas of your website are getting the most clicks. The areas with the most clicks are usually the ones that are the most important to your visitors. Click heatmaps can help you identify areas that are not getting enough attention, allowing you to make changes to improve engagement.
Scroll heatmaps
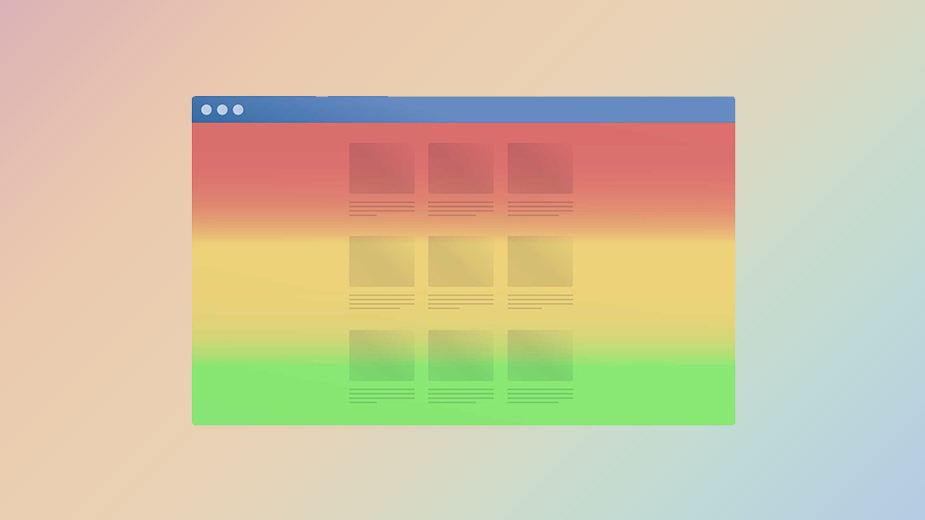
Scroll heatmaps show you how far down the page your visitors scroll. This can help you identify which parts of your website are the most engaging and which ones need improvement. Scroll heatmaps can also help you determine if visitors are missing important information because it’s located too far down the page.
Move heatmaps
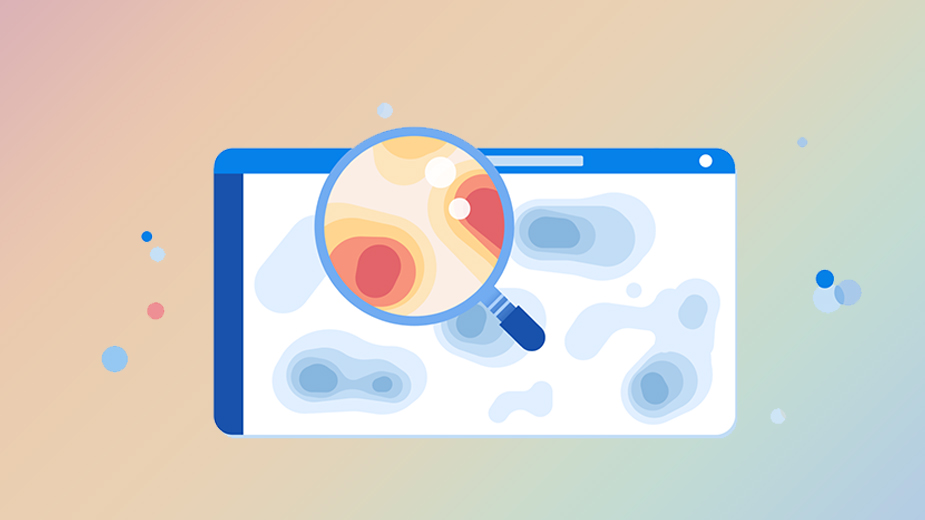
Move heatmaps track the movement of your visitors’ cursors. This can help you understand how users navigate your website and which areas are the most interesting to them. Move heatmaps can help you optimize your website’s layout to improve engagement.
Did you know?
In some tools, you may encounter another type of heatmap called segment heatmaps. Capturly’s offer includes the ability to easily distinguish between the behaviors of visitors from different referrers, device types, browsers, or operating systems using segment heatmaps.
Why should you use heatmaps for improving UX?
Using heatmaps can help you make data-driven decisions about how to improve your website’s UX. By understanding how users interact with your website, you can make changes that will increase engagement and conversions. Heatmaps can also help you identify areas of your website that are not getting enough attention, allowing you to make changes to improve visibility.
Heatmaps are easy to use and provide a visual representation of data that can help you quickly identify areas of your website that need improvement. By using heatmaps, you can optimize your website for better UX, leading to increased engagement and conversions.
Top Benefits of Using Heatmaps
We collected some benefits of using a heatmaps feature.
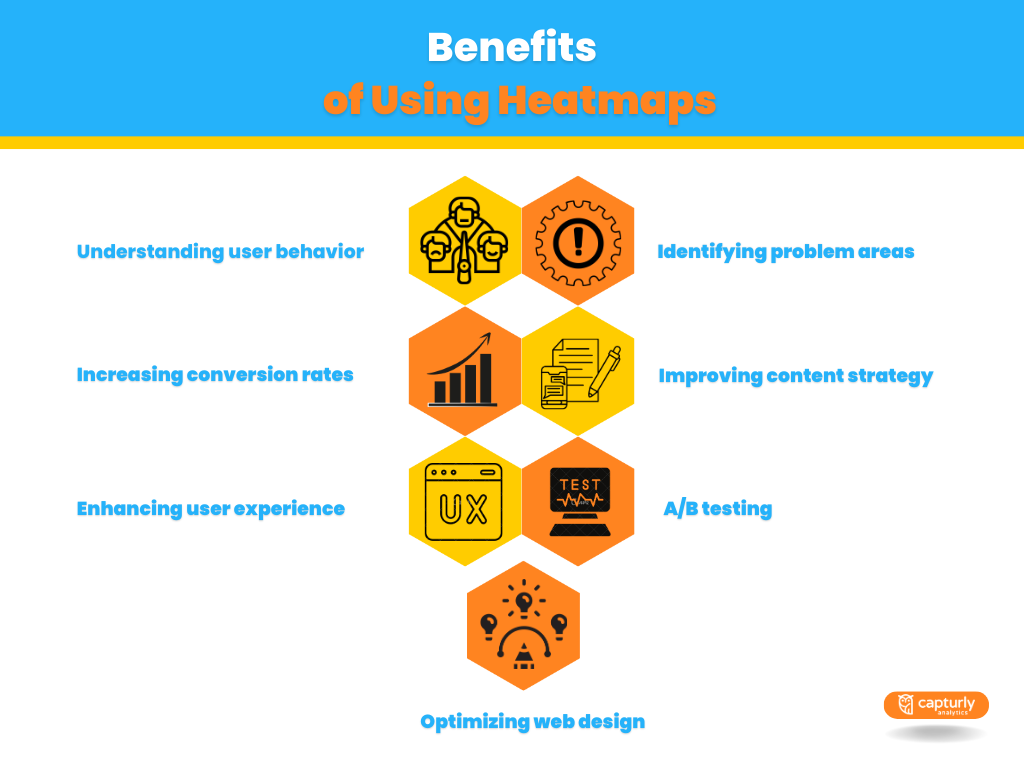
Understanding User Behavior
Heatmaps are commonly utilized to evaluate user behavior and engagement on a website. Heatmaps help you identify trends and patterns in how users interact with your site.
You can see which parts of the page attract the most attention, where users spend the most time, and what elements are frequently clicked. This information is invaluable for understanding what drives user engagement and can help you make data-driven decisions about your site’s design and content.
Identifying Problem Areas
Heatmaps can help you pinpoint areas on your website where users are experiencing difficulties or frustration. For example, if a button is frequently clicked but not leading to conversions, it could indicate a technical issue or unclear messaging. Identifying and addressing these problem areas can significantly improve your site’s overall performance.
Increasing Conversion Rates
By understanding how users interact with your site, you can make changes that encourage them to take desired actions, such as signing up for a newsletter or making a purchase. Heatmaps can help you identify the most effective call-to-actions, placement of buttons, and other elements that contribute to higher conversion rates.
Improving Content Strategy
Scroll heatmaps, in particular, can provide insights into how users consume your content. You can determine the optimal length for your articles and identify which sections are most engaging, allowing you to tailor your content strategy to better meet the needs and preferences of your audience.
Enhancing User Experience
Analyzing heatmap data allows you to create a more enjoyable and intuitive user experience. By understanding what users find most engaging, you can prioritize these elements and eliminate any barriers that may be causing frustration. A better user experience often leads to increased time spent on your site, higher engagement, and ultimately, more conversions.
A/B Testing
Heatmaps are a valuable tool for A/B testing, allowing you to compare different versions of your website or specific elements to determine which one performs better. By visualizing user interactions, you can make data-driven decisions about which design or content elements to implement for the best results.
Optimizing Web Design
By understanding heatmaps, you can identify the most effective layout and design elements for your website, in line with current web design trends. This information can be used to create a visually appealing and user-friendly site, resulting in enhanced engagement and increased conversions.
Creating and Implementing Heatmaps
There are numerous heatmap tools available, both free and paid, that can help you analyze your website data. Once you have chosen a tool, implementing heatmaps is relatively straightforward:
- Sign up for an account with the heatmap tool of your choice.
- Add the tracking code to your website.
- Begin collecting data and analyzing the results.
- Remember to continually monitor your heatmap data and make changes to your site based on the insights you gain. This will ensure that you are always optimizing your site for the best possible user experience and conversion rates.
You can look at Capturly’s offer for heatmap analytics free/paid version.
20 Tips for Using Heatmaps to Improve Your Website’s User Experience
If you want to stand out from your competitors in terms of the UX of your website, here are 20 tips for you to consider.
Identify user behavior patterns
The main goal of heatmaps are the analysis of user behavior, which could not be used for better purposes than creating patterns. From these patterns, you can draw significant conclusions about the UX of your website.
Tracking mouse movement and clicks
Heatmaps can help you track mouse movements and clicks, showing where users are interacting with your website. By understanding these patterns, you can identify trends and optimize your site to better cater to your audience’s needs.
Identifying trends
Look for recurring patterns in user behavior, such as popular areas of the page or frequently clicked elements. Use these insights to improve navigation, prioritize content, and create a more user-friendly experience.
Analyze page engagement
By analyzing heatmaps, you can gain insights into how users are engaging with the content on your site, which can help you identify areas of improvement and optimize your website for better user experiences.
Measuring scroll depth
Scroll depth heatmaps show how far users scroll down your pages. Use this information to optimize the content placement, ensuring that important information is visible to the majority of users.
Time spent on page
Heatmaps can also help you understand how long users spend on your pages. Analyze this data to identify engaging content and areas that may need improvement.
Optimize call-to-action (CTA) placement
At the end of the day, it’s all about CTAs and their success, isn’t it? That’s why it should be a fundamental goal of yours to have them in the right place and in the right quality on your website!

Placing CTAs in high-engagement areas
To increase conversion rates, place your CTAs in areas with high user engagement. Heatmaps can help you identify these high-activity areas, ensuring your CTAs are seen and interacted with.
A/B testing for effectiveness
Test different CTA placements and designs by running A/B tests. Heatmaps can provide data on which variations perform best, allowing you to optimize your CTAs for maximum conversions.
Discover navigation issues
Once visitors get to your website, it is essential that they find what they are looking for! That is why it is necessary to make improvements for better navigation!
Identifying confusing menus
Heatmaps can reveal confusing or inefficient menu structures. If users are not clicking on certain menu items or are clicking in unexpected areas, consider revising your navigation to improve user flow.
Improving user flow
By analyzing heatmap data, you can identify bottlenecks or dead ends in your site’s navigation. Use this information to streamline your site’s structure and create a more seamless user experience.
Enhance readability
If you’re spending time creating content for your site, it’s essential that it’s enjoyable and practical for your visitors! Hetamaps can also help with that!
Adjusting font size and style
If your heatmaps show low engagement, consider adjusting font size, style, or formatting to improve readability. Experiment with different options to find the best fit for your audience.
Breaking up large blocks of text
Large blocks of text can be intimidating and difficult to read. Use heatmaps to identify areas where users are dropping off, and break up text into smaller paragraphs or bullet points to make it more digestible.
Improve page layout
Design matters a lot in terms of what information actually reaches the user and what information is overlooked because of a poor display.
Structuring content effectively
Use heatmaps to understand how users interact with your content. Structure your page layout to prioritize important information and make it easy for users to find what they are looking for.
A/B testing layouts
Test different page layouts using A/B testing and heatmap data. Refine your layout based on user engagement and behavior patterns to create the most effective design.
Evaluate mobile responsiveness
It is a well-known fact that users now access websites through various devices. In fact, 90% of people use more than one device to complete a task and they anticipate a consistent browsing experience across all devices. That’s why it is crucial to care about mobile responsiveness!
Ensuring a seamless experience across devices
As more users access websites on mobile devices, it’s crucial to ensure your site is mobile-responsive. Using segment heatmaps is a good idea to identify any issues or discrepancies between desktop and mobile user behavior.
Optimizing for touch interactions
Mobile users interact with your site using touch, which can differ significantly from mouse-based interactions. Optimize your site for touch interactions by analyzing heatmap data and making necessary adjustments.
Spot distracting elements
Why spend so much time creating the perfect website if you’re going to let unnecessary elements distract your visitors? Don’t worry, you can easily avoid this mistake!
Removing unnecessary visuals
Unnecessary visuals can distract users from your site’s main content or CTAs. Use heatmaps to identify these distractions and consider removing or simplifying them to improve user focus.
Simplifying designs
A cluttered or busy design can be overwhelming and detract from your site’s message. Analyze heatmap data to identify areas that may be too visually complex and simplify them to create a cleaner, more focused experience for your users.
Uncover hidden usability issues
There are things on a website that can be invisible to your eyes, such as links that lead nowhere, or accessibility problems. They are still there in the background and interfere with the user experience. But don’t worry they don’t have to be invisible!
Identifying broken links
Heatmaps can help you identify broken links on your site. If users are clicking on elements that don’t lead anywhere, consider fixing or removing these links to improve usability.
Testing for accessibility
Ensure your site is accessible to all users, including those with disabilities. Use heatmaps to identify potential accessibility issues, such as elements that are difficult to interact with, and address them accordingly.
Test design variations
Testing is always a good tool in your hand! This way, you can always vote for the best version and make the user experience on your site better.
Comparing different versions
Heatmaps allow you to compare different design variations and see which one resonates best with your users. Use this data to refine your design and create a more effective user experience.
Refining designs based on data
Use heatmap data to make informed design decisions. Continuously test and refine your design based on user behavior to ensure your site remains effective and engaging.
Monitor the impact of changes
Continuity is a must in the world of websites, as it’s important to react immediately to emerging trends and changes. By continuously monitoring your heatmap data, you can track these behavioral changes!
Tracking performance over time
Use heatmaps to track the performance of your site over time. Regularly analyze this data to identify any emerging trends or issues that need to be addressed.
Continuously improving the user experience
Make ongoing improvements to your site based on heatmap data. By continually optimizing your site, you can ensure it remains engaging and relevant to your users.
Segment heatmap data
The best way to examine segments is to use a heatmap tool that offers segment heatmaps feature!
Analyzing user groups
Segment your heatmap data by different user groups, such as new vs. returning visitors or users from different geographic locations. This can help you identify unique preferences and behaviors, allowing you to customize your content and design for different segments.
Customizing content for different segments
Tailor your content and design to cater to the needs of different user segments. This can help create a more personalized experience, resulting in higher engagement and conversion rates.
Optimize forms
With the help of heatmaps you can measure not just the performance of your website but the performance of different elements, like forms on it!

Simplifying form fields
Long or complex forms can deter users from completing them. Analyze heatmap data to identify areas of friction and simplify your forms by reducing the number of fields or streamlining the layout.
Reducing friction
Identify and eliminate any unnecessary steps or barriers in your forms. Use heatmap data to understand where users may be getting stuck or dropping off, and make adjustments to improve the user experience.
Prioritize content
You wouldn’t think it, but a lot depends on prioritization and what is the first content a user comes across.
Focusing on high-value content
Use heatmaps to identify the most engaging content on your site. Prioritize this content, making it more prominent and easily accessible to users.
Reorganizing content for maximum impact
Rearrange your content based on heatmap data to ensure it aligns with user behavior and preferences. This can help improve engagement and drive conversions.
Understand audience preferences
Whatever decisions you make on your website, the most important thing to consider is your users and making decisions that will improve their user experience the most.
Tailoring content to user interests
Analyze heatmap data to understand your audience’s interests and preferences. Use this information to create content that appeals to your users and keeps them engaged.
Leveraging demographic data
Segment your heatmap data by demographic information, such as age or gender, to gain insights into the preferences of different user groups. Use this information to tailor your content and design accordingly.
Maximize image effectiveness
Images and their placement contribute greatly to the user experience, as these are the design elements that resonate most with users.
Choosing compelling visuals
Use heatmaps to evaluate the effectiveness of your images. Select compelling visuals that grab users’ attention and drive engagement.
Testing image placement
Experiment with different image placements and analyze heatmap data to find the most effective location for your visuals.
Evaluate the power of social proof
Social proof has a big impact on what visitors think about your website. But once you have these elements, it’s also important that users encounter them.

Harnessing testimonials and reviews
Social proof, such as testimonials and reviews, can help build trust with your users. Use heatmap data to identify the most effective placement for these elements and ensure they are easily visible.
Highlighting social shares
Track social sharing buttons’ engagement using heatmaps. Optimize their placement to encourage users to share your content with their networks.
Monitor seasonal trends
The recognition of seasonal trends is crucial in a competition. At the end of the day, it matters a lot which brand can adapt the most to the behavior of its users. If you ignore or do not recognize these seasonal trends you can easily lag behind.
Adapting content for seasonal fluctuations
Adapt your content to accommodate seasonal trends and fluctuations. Use heatmap data to identify changes in user behavior and preferences throughout the year, and adjust your content strategy accordingly.
Capitalizing on timely events
Monitor heatmap data during specific events or holidays to identify opportunities for timely content. Capitalize on these trends by creating relevant, event-driven content that engages your audience.
Refine search functionality
One of the most important aspects on a website is not to lose visitors who are already interested in buying just because the search functions on your site are not working properly.

Streamlining search features
Optimize your site’s search functionality by using heatmap data to identify areas of confusion or inefficiency. Make adjustments to streamline the search process and improve the user experience.
Optimizing search results
Analyze heatmap data to understand how users interact with your search results. Use this information to optimize the presentation and relevance of search results, ensuring users find what they’re looking for.
Leverage video engagement
Video content can greatly help your conversions if it appears in places with a high drop-off rate. To find these places, it is essential to use heatmaps.
Incorporating video content
Videos can be a highly engaging form of content. Use heatmaps to identify areas where video content may be beneficial and incorporate it into your site to drive engagement.
Analyzing video heatmaps
Video heatmaps can provide insights into how users interact with your video content. Use this data to optimize video length, placement, and content to maximize engagement.
Conclusion
Effective utilization of heatmaps can significantly enhance your website’s user experience, engagement, and conversion rates. Following the tips outlined, developers from renowned web design companies can harness the power of heatmap data to make informed decisions and create a more effective, user-friendly site. Heatmaps offer valuable insights into how users interact with your website, allowing for data-driven decisions on how to optimize it for better engagement and conversions. With heatmaps, you can create a visually appealing and user-friendly website that delivers an exceptional user experience.
In conclusion, heatmaps are a valuable tool for website owners who want to improve their website’s UX. By using heatmaps, you can gain insights into user behavior and make data-driven decisions about how to optimize your website for better engagement and conversions. Regular use of heatmaps, along with other UX tools and data sources, can help you create a website that provides an excellent user experience and helps you achieve your business goals.
FAQ
Q: How do I create a heatmap for my website?
A: Many heatmap tools are available online, such as Capturly, that allow you to create heatmaps for your website.
Q: How often should I use heatmaps to optimize my website?
A: It’s a good idea to use heatmaps regularly to track changes and make sure that your website is optimized for the best UX possible.
Q: Can heatmaps help me improve my website’s conversion rate?
A: Yes, heatmaps can help you identify areas of your website that are not getting enough attention and make changes to increase engagement, leading to higher conversion rates.
Q: Can heatmaps be used for mobile websites?
A: Yes, heatmaps can be used for mobile websites, but it’s important to use a heatmap tool that is optimized for mobile devices.
Q: How can I use heatmaps to optimize my website’s layout?
A: By analyzing your website’s scroll and click heatmaps, you can identify which areas of your website are getting the most attention and make changes to improve the layout, such as moving important elements to more prominent locations.
Q: Can I use heatmaps for A/B testing?
A: Yes, heatmaps can be a useful tool for A/B testing by helping you identify which version of a page is more engaging to users.