Are you struggling to increase your website’s conversion rates and general performance? As a website owner or digital marketer, A/B testing can be an effective approach to take. This method lets you pinpoint which changes will have the biggest impact on how well your website performs.
If you don’t have precise data, it can be tough to decide which changes to make. But you can use heatmaps to solve this problem. Heatmaps are essential tools that can help you improve your website and make it more user-friendly.
| Did you know? According to Converter’s statistics, 94% of beginner testers are not prioritizing tests objectively. This means they make decisions based on bias instead of facts. But by using heatmaps, you can avoid it. |
In this article, we’ll discuss heatmaps and how they can help you with A/B testing. You’ll learn how heatmaps can improve your website and get 13+1 simple ways to use them effectively.
Table of Contents
What are heatmaps?
Before we get into anything, let’s see exactly what heatmaps are. Heatmaps are used in many industries. You may have seen it in geographical data visualization and financial, business, or weather analysis.
Heatmaps are a useful way to see how visitors behave on your website. They show you which parts of your website get the most attention, using colors to make them easy to understand. By analyzing a heatmap, you can learn how engaged users are with your website and whether your design is working well.
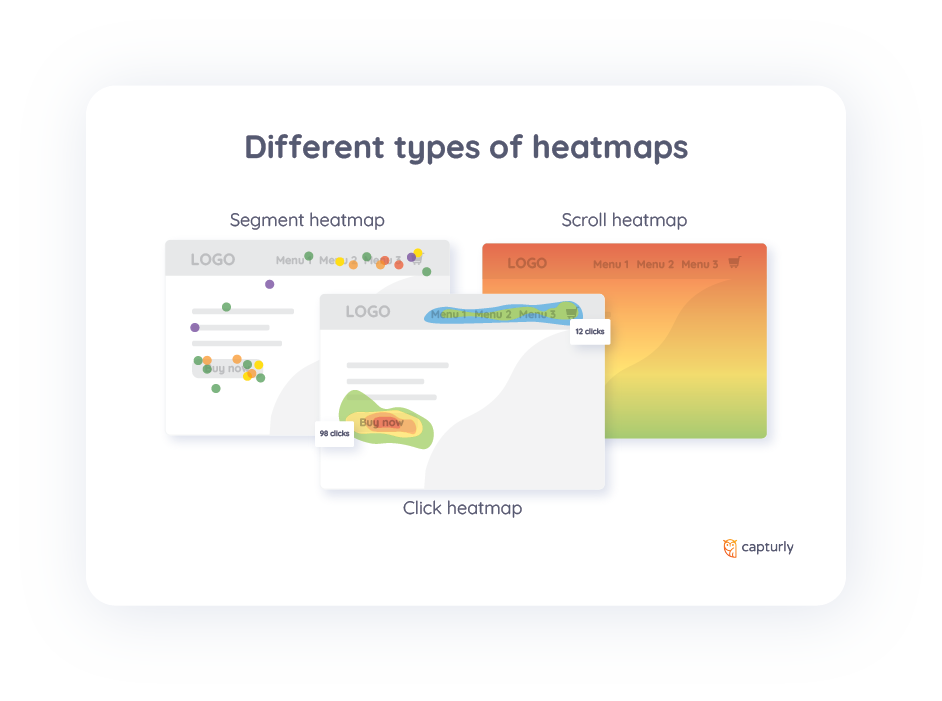
There are 3 types of website heatmaps:
Click heatmaps
Want to know where your website users are clicking? Use click heatmaps! These powerful tools show which parts of your website are popular and which are ignored. Analyze user behavior, optimize CTAs and menu positions, and increase your conversion rate. Don’t overlook the power of click heatmaps for a better user experience!
Scroll heatmaps
Wonder why useful information on your website doesn’t reach customers? Scroll heatmaps show how far visitors scroll down web pages and the percentage of people who reach specific sections. Analyzing the data can help you get more people to buy your product by putting the important stuff where it’s easy to see.
Segment heatmaps
Segment heatmaps group website visitors based on attributes like their device type or operating system. This helps you understand how people behave on your website. By analyzing this data, you can optimize your website for your target audience. For example, you might need to make changes to your mobile site or adjust your content for users who come from search engines. Get the insights you need to improve your website with segment heatmaps!
What is A/B testing?
A/B testing is a powerful technique for improving your website’s conversion rate and increasing your income. It’s very simple: you change one thing on your website (let’s call it version B), then compare it to the original version (version A) to see which works better.
By making small changes and comparing the results, you can learn a lot about what works best for your users. Maybe your call-to-action button needs to be in a different place, or perhaps changing the color of a T-shirt on your model will make a big difference. With A/B testing, you can easily optimize and tailor your website to meet the needs of your users.
And the best part? You don’t need to be a technical genius to run an A/B test. There are plenty of tools out there that make it easy to set up and run experiments on your website. So why not give it a try and see how it can help you improve your website’s performance?
What’s the difference between A/B and multivariate testing?
It’s not uncommon for people to mix up A/B testing and multivariate testing. But there’s a significant difference between the two.
With A/B testing, you compare two different versions of your website to see which one performs better. This involves changing just one element at a time, like the color of a button or the wording of a headline.
Moreover, multivariate testing involves changing various elements at once. This approach can be useful if you want to test several different variations of your website to see which combination of changes works best.
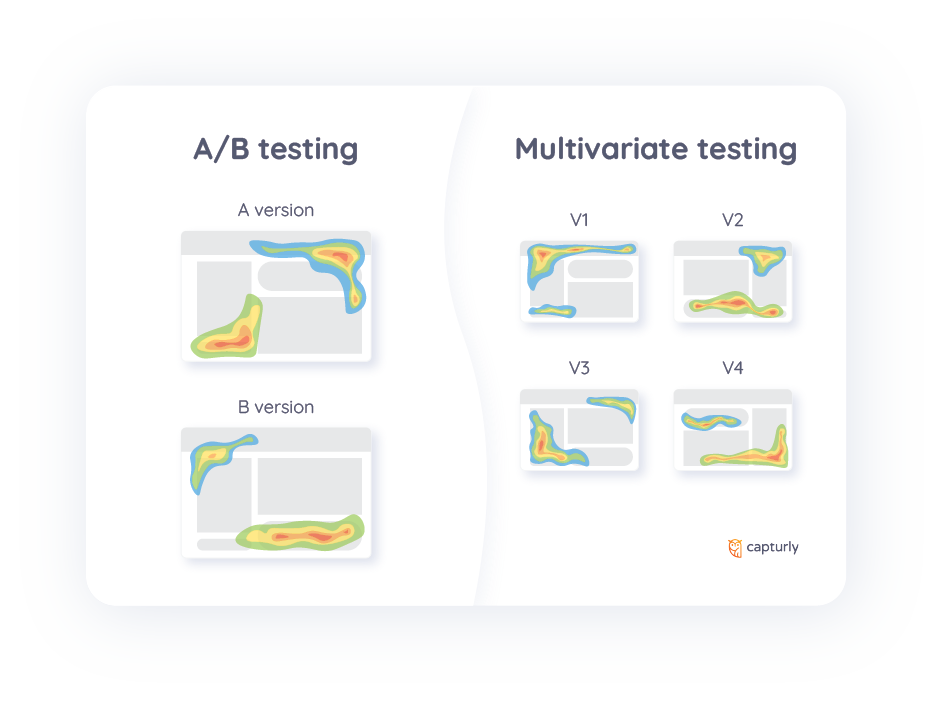
Both A/B testing and multivariate testing can help make your website better, but it’s important to know how they differ from each other. That way, you can choose the right approach for your specific needs and goals.
So next time if you want to test different versions of your website, keep in mind the difference between A/B testing and multivariate testing. With this knowledge, you can make informed decisions about which testing strategy to use and get the most out of your experiments.
Why is a heatmap essential in A/B testing?
Heatmaps are helpful tools that show where users click, scroll, and hover on your website. By using heatmaps, you can quickly see which parts of your website work well and which ones need improvement. Heatmaps can even reveal user behavior patterns that other metrics might miss.
Use the insights from your heatmaps to plan future A/B tests and optimization strategies. This will help you create a great user experience that keeps people coming back to your website. Essential for any website owner or designer looking to improve engagement!
How to use heatmaps for A/B testing?
Are you looking to make data-driven decisions and optimize your website’s design for better user engagement? Here are some ways you can make effective use of heatmaps in A/B testing to achieve the best performance.
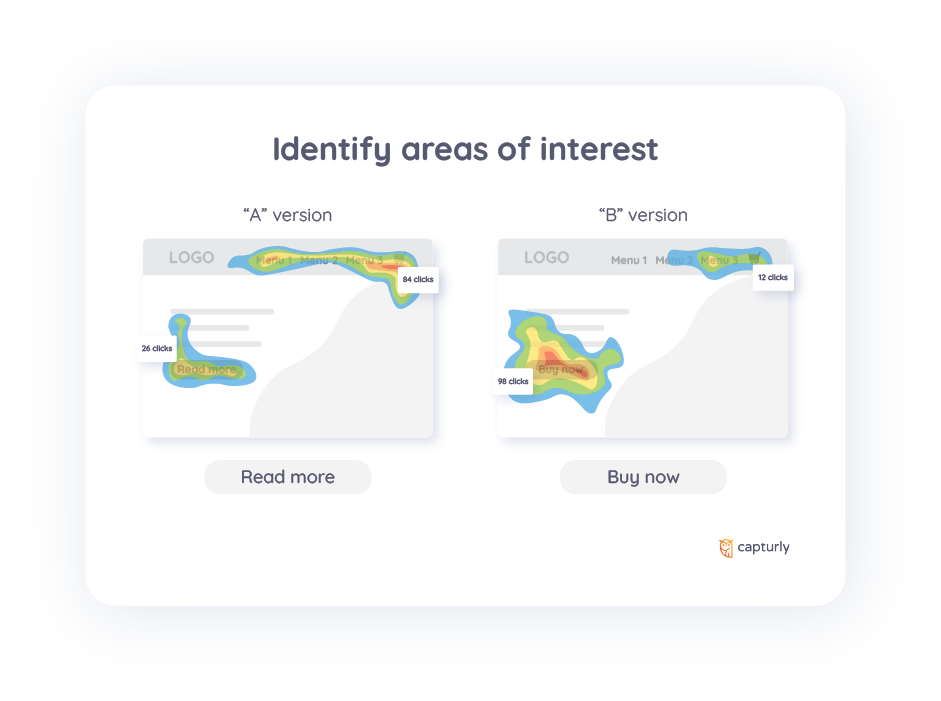
#1 Identify areas of interest
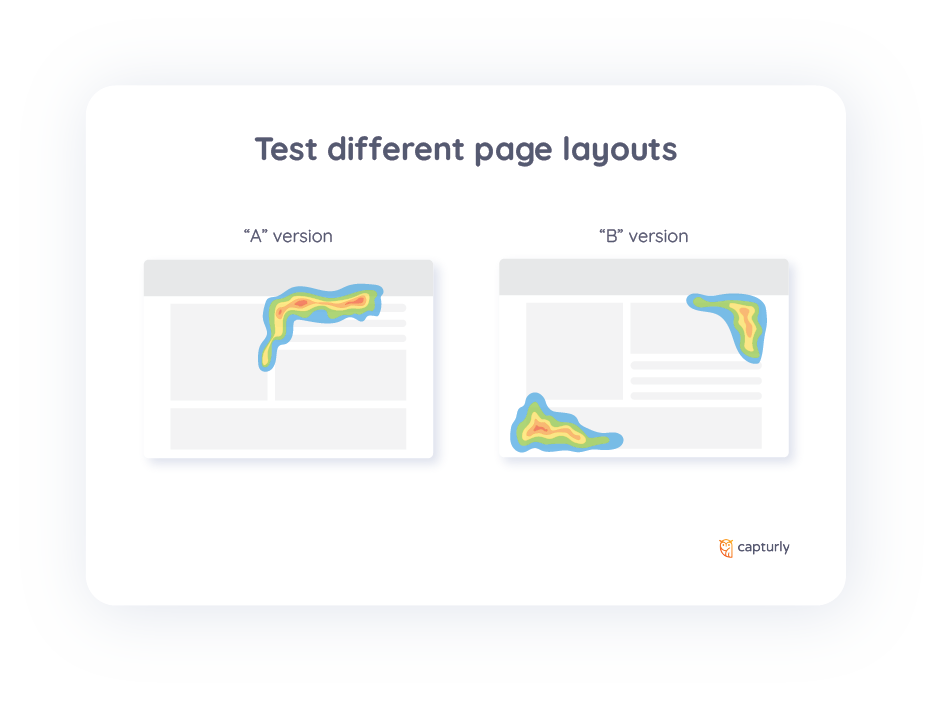
Heatmaps are a great tool for understanding user behavior on your website. They show you which parts of the page are being clicked on the most, highlighted in red for easy identification. For instance, in the figure below, version A has a more frequently clicked menu.
If you want to improve a specific call-to-action (CTA) button, you can easily make changes to its text or design. Ultimately, the choice of version depends on your goals and what you hope to achieve with your website. Take some time to think about your objectives and make an informed decision that works best for you.
#2 Analyze click patterns
Heatmaps can be a valuable tool for analyzing click patterns and identifying areas of your website that may need improvement. Compare heatmaps of different webpage versions side-by-side to see how users behave differently.
Use this information to make changes and continue testing until you reach full user engagement. Remember, optimization is an ongoing process, so don’t hesitate to seek help from our team of experts.
#3 Check out page scrolling
It’s a common issue that many website owners face – they tend to place important information in areas where users don’t scroll down. If you happen to be a website owner, I’d suggest taking a look at the heatmap to ensure that the essential information is in the right place.
Remember that if users don’t scroll down to a certain part of your website, it’s better not to put any important information there. Otherwise, they might miss it. After all, you want to make sure your users have a great experience on your website and find what they’re looking for easily.
#4 Test different page layouts
Different page layouts play a crucial role in creating unique user experiences. How you design the user experience on your website can have a big impact on your conversion rate and your revenue. It’s important to consider your target audience when crafting your UX, as their preferences and needs may differ greatly.
Let’s look at an example. If your target audience is young gamers, make sure that your website matches their personality and needs. Make it rich and dynamic. If your target audience is mainly older business people, focus on making your website easy to use and accessible for them. Have authority and reflect your brand personality.
#5 Optimize form completion
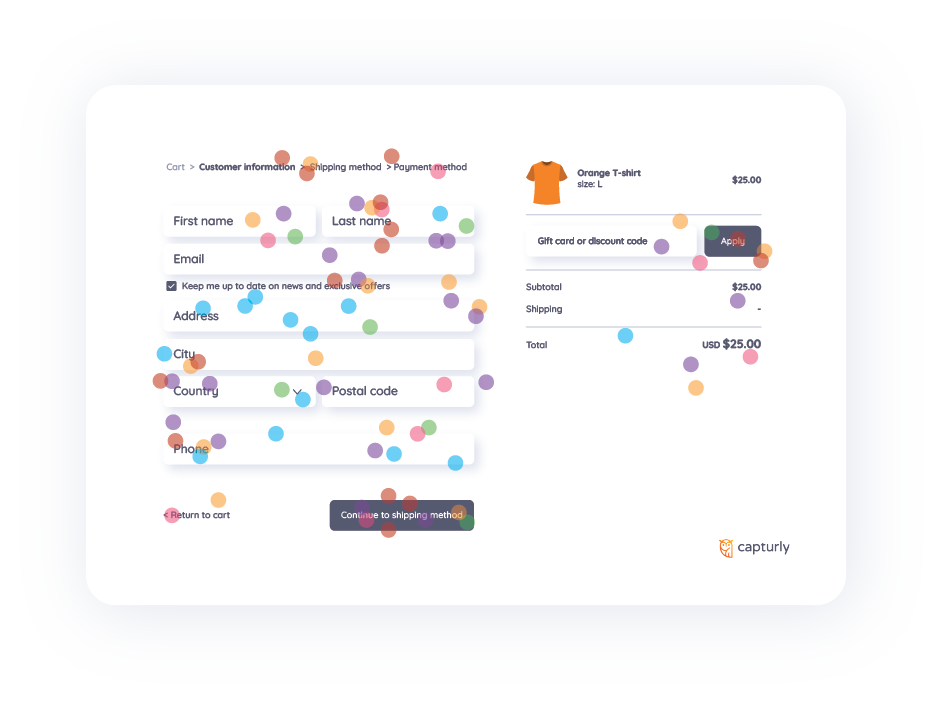
| Did you know that 81% of people have abandoned a form after beginning to fill it out? |
Making online forms easy to use is crucial for increasing conversion rates. By simplifying the form-filling process, you can encourage more people to complete the form.
A/B testing is a useful tool for analyzing user behavior and making informed decisions about your website’s design. By using a click heatmap, you can see exactly how users are navigating your site and identify any areas where they may be getting stuck.
To get more people to complete your online forms, you can make changes based on how users interact with them. Paying attention to the user experience and making adjustments can help you get better results.
#6 Perfect your product images
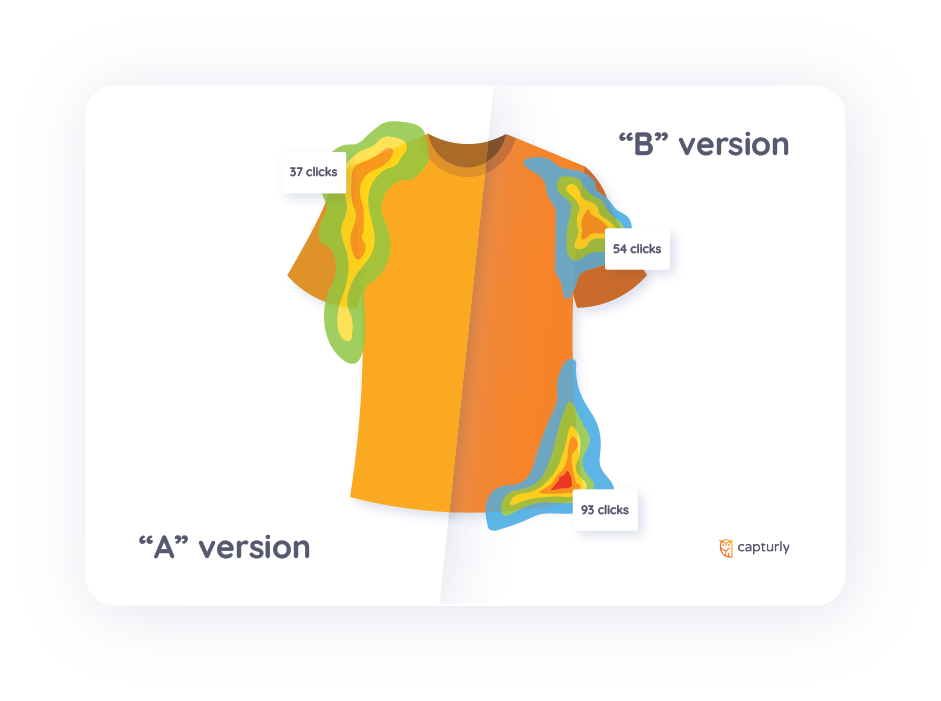
When it comes to online shopping, product images are absolutely essential for driving sales. When shopping online, customers can’t touch or see the products in person before buying them. That’s why having high-quality images optimized for the web is important.
By testing different product images and optimizing them for the greatest impact, you can boost your sales and revenue. One effective way to do this is through A/B testing, which allows you to experiment with different images and see which ones perform best.
And when it comes to analyzing the results of your A/B tests, heatmaps are an invaluable tool. They give you a detailed look at how customers interact with your product images, so you can identify any areas where improvements can be made.
You can make your customers happy and earn more money by paying attention to your product images and using data to improve your online store.
#7 Find ideal product positioning
As we discussed in the section on page layouts, the placement of information is absolutely critical. In particular, the way you position your products can have a huge impact on whether customers choose to buy them.
It’s crucial to give extra attention to your most profitable products since they make the most money. This way, you can make sure they get the attention they need. But, it’s possible that the positioning of these products might not be ideal for your customers, which can hurt your revenue.
A/B testing and the usage of heatmaps are helpful tools to determine the best placement for your products. You can experiment with different placements and see which one your customers prefer. Data can help you find the perfect spot for your top products, so you can make more money and improve your customers’ shopping experience.
Make your website simple and place your products in the right place to keep your customers coming back.
#8 Refine navigation and menus
Have you ever tried to buy something online but the website’s menu is so complicated that you feel like giving up and leaving? I’m sure you understand the importance of having a user-friendly menu that helps shoppers easily find what they’re looking for.
If your website’s menu is confusing, potential customers may leave and you’ll lose money. But, if you regularly check how customers are clicking and scrolling, you can find and fix problems, making it easier for them to buy from you.
#9 Streamline checkout flows
If your checkout process is complicated, it can have a negative impact on your earnings. Make it easy for your customers to shop and buy from you by understanding their needs and simplifying their experience.
If your checkout process is too complicated, customers might leave and you’ll lose revenue. So, make sure to test and track it regularly, listen to your customer’s feedback, and make changes to improve your sales.
You can make some simple changes to improve your sales and make your customers’ shopping experience better.
#10 Boost sales with smart upselling
Discovering the ideal upsell product can feel like a refreshing oasis in the middle of a scorching desert. It’s a game-changer that can significantly boost your revenue, but it often takes time and effort to find the right fit.
If you suggest a well-timed and relevant product at the end of the shopping process, it can really boost your sales. To identify the perfect upsell product, conducting A/B testing is a reliable way to see what resonates best with your customers.
Using click heatmap analysis and A/B testing can help you make your upsell offers better and get more sales. By planning carefully and paying attention to details, you can increase your cart value and make more money for your business.
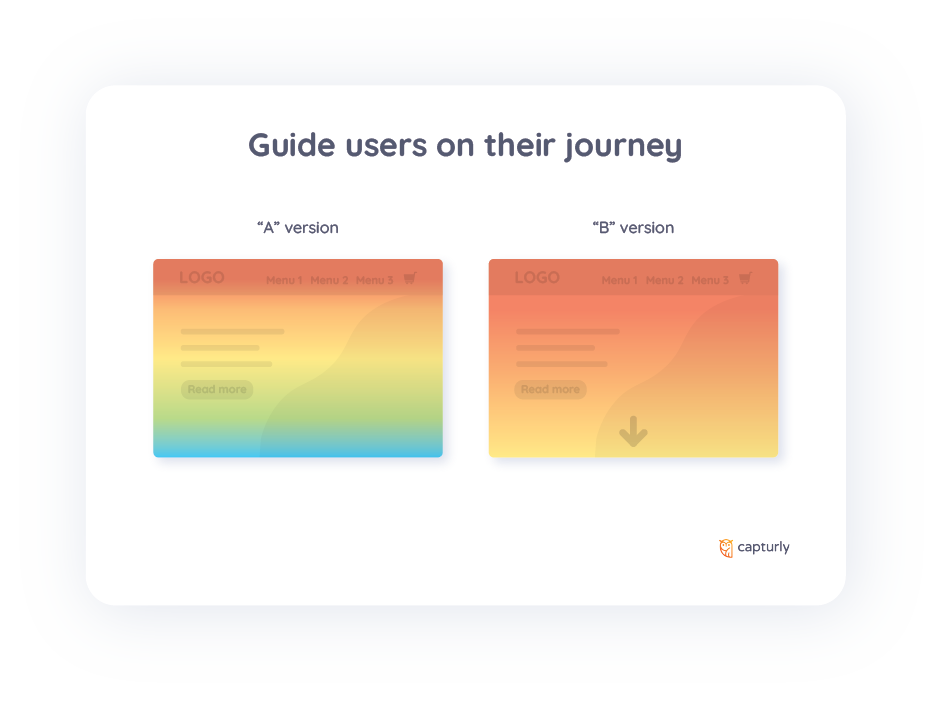
#11 Guide users on their journey
It’s really important to make sure your website is easy to use for your customers. If it’s not clear what they should do or how to do it, they might leave without buying anything or signing up for your newsletter. This can be a nightmare for any business owner because it means fewer people will do what you want them to do, which can also hurt your revenue. So, make sure you have clear instructions and a simple design that helps your customers know what actions to take on your website.
On the other hand, when you provide a seamless and straightforward user experience, you can generate leads and build a loyal customer base. If you want to make your website easy to use for your customers, you need to know how they behave on your site. This means identifying any places where they might have trouble.
If you do your research and analyze your website’s data, you can make better decisions that will improve your customers’ experience. This will help you be more successful overall.
#12 Fine-tune font styles and sizes
The designers’ community website, Dribbble.com estimates that 85% of fonts are sans-serif, with the rest being serif, monospaced, and everything else.
Picking the right font for your website is super important if you want it to look good and be trustworthy. It’s best to use fonts that are easy to read because difficult ones can quickly turn potential customers away from your site.
The font you choose for your website can affect how people see your brand. If you pick the wrong one, it could make you look bad. As an example, imagine a criminal lawyer’s website that uses the font, Comic Sans. It wouldn’t seem professional and could hurt their reputation.
Thus, it’s essential to select a font that aligns with your brand’s personality and target audience. To ensure that your font choice resonates with your users, conduct thorough testing to see how they respond. Will they leave the site? Will they continue browsing? Or will they make a buy?
When you’re selecting a font, keep these factors in mind to make sure it enhances your users’ experience and reinforces your brand identity.
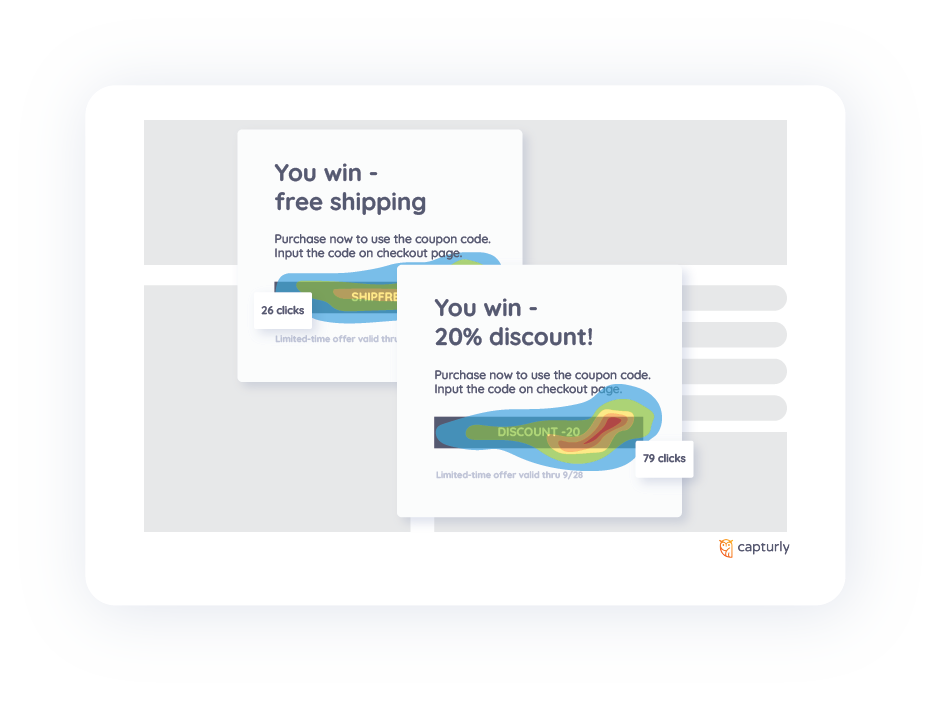
#13 Design engaging pop-ups
The key is to determine your goals and create pop-ups that align with them. For example, if your goal is to capture email addresses for your newsletter, a pop-up can be an effective tool to achieve this. A/B testing is also a great way to optimize your pop-ups and ensure that they are as effective as possible.
To make your pop-ups work better, try out different designs, messages, and timing until you find what works best for your business.
+1 Create a seamless onboarding experience
When new users visit your site, they may feel a bit disoriented, especially if your site has a more intricate or unusual interface. To keep people interested and using your product or service, it’s important to make the first steps as easy as possible.
As we’ve discussed before, complicated navigation and unclear instructions can quickly deter customers. This is especially true for new users who may feel lost when trying to discover your site. Make things easier for your users by being helpful and considerate. Use pop-ups, information points, and clear instructions to guide them along the way.
A/B testing and heatmaps can also help you design and optimize these elements for the best possible onboarding experience.
How can you achieve your goals?
You read a lot about heatmaps, but are still not sure how to get started. Capturly’s heatmap tool can help you to make your dreams happen. Boost your website’s conversion rates and get the most out of your online presence
Capturly’s heatmap helps you see how people use your website with heatmaps such as scroll, click, and segment heatmaps. With A/B testing, you can figure out what changes on your website make people more interested and likely to buy something.
Check out our Heatmap Guide to learn more about heatmaps and how they can improve your website. It has everything you need to know! We’re committed to helping you achieve your goals with ease, so don’t hesitate to reach out if you have any questions or need help.
Conclusion
To make a website that’s successful and makes a lot of money, you need to regularly review and test everything on it. That means things like the design, layout, text, images, and font all need to be checked. Continuous A/B testing can make decision-making easier and streamline website optimization. By utilizing different heatmaps during A/B testing, you can easily identify areas where you may be losing or retaining users.
Heatmaps can show you important things you might not have noticed if you were only looking at the numbers. Remember, staying on top of these details can make a significant difference in the overall success of your website.