Understand your users! This is the most common sentence you hear from E-commerce sellers, and it’s not a coincidence. It is trivial that by just not knowing what your customers want, you will lose many many deals.
But is it essential what they want? There is a book for the perfect instructions that will work all the time? No, I’m afraid, there isn’t. It all depends on some unique specifics, like:
- The demographics of your target group(s)
- The product or service you want to sell
- The financial situation of your target group(s)
- The industry you are in
There are a bunch of other specifics that I didn’t mention but can differentiate how you need to build your site for the perfect effect. Although you can create sites by just your own personal recommendations, and ideas, I’m sure your customers will also have something to tell you which elements you can still improve. Moreover, even if you simply make a mistake they can notify you. Not just with comments, but with their behavior also.
Most of the time, it is more effective to get to know your visitors via analyzing their behavior, than asking their opinions all the time. They can’t share every specific information, they get bored sooner or later because of the continuous questionnaires, and it takes a lot of financial resources to connect these questionnaires with your visitors. On top of that, it requires some time to evaluate the results.
That’s why we need to use another method for understanding the users. User behavior analytics was born for this purpose!
Table of Contents
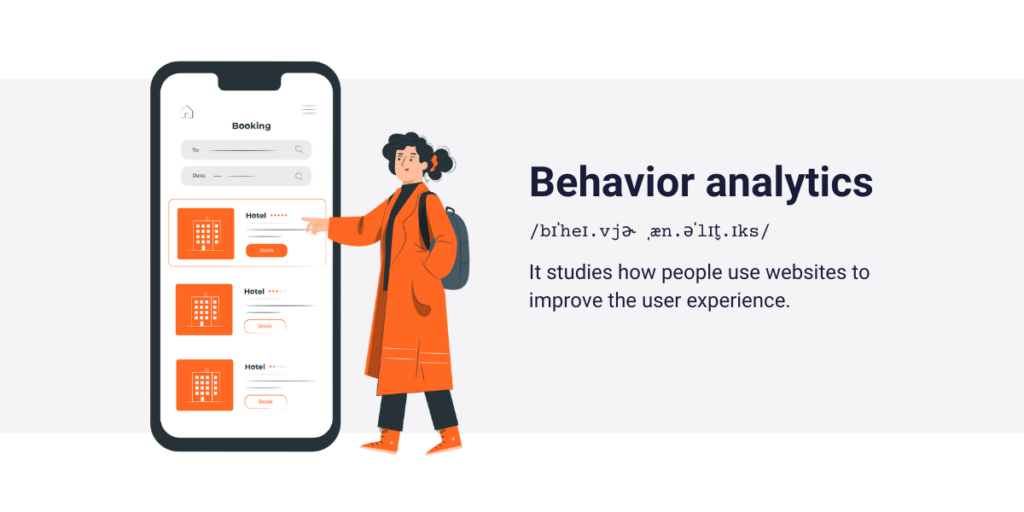
What is the definition of user behavior analytics?
User behavior analytics can mean two different things, so it’s better to look at the difference between these two definitions.
Based on Cyberark’s definition, user behavioral analytics is a solution combined with artificial intelligence and machine learning to help identify different patterns. Patterns that can lead to malfunctioning activity, data breaches, or other online harmful activities. In this case, we analyze these data to pinpoint our weaknesses that can lead to data thefts.
On the other hand, behavior analytics is a method for collecting both quantitative and qualitative data to understand how the user interacts and behaves on our site, in order to figure out what these users want, where they struggle or get stuck, or what are they doing right before quitting our site. At this time, we analyze these data to make the customers more engaged and stimulate them for later repurchases. But these analyzed data can not influence real-time first-time visitors, right? Yes, that’s true. This data is only valuable if we can reach our buyers at least twice.
However, this is not much of a problem. Researchers have found out that it’s cheaper to convince those buyers who once chose you, than those who have never bought anything from you in the past.
As you can see, the two definitions cover two different topics. The first covers data protection since many companies use behavioral analytics to defend themselves from malicious software. On the contrary, the second definition emphasizes user behavior analytics to understand your visitors better, and in the long run, reach better conversion rates, sell more products, and get more revenue.
In this article, we will take a deeper look at the second definition. Although I wrote some words about the possible advantages of using them, I insist we should understand these opportunities more in-depth.
How to install it?
After you find the perfect tool for your needs, and buy it, or use the free, but trial version, or a completely free software; you are not done with your doings. These programs can’t track your site’s user interactions, without installing a code on your site.
It doesn’t require much programming knowledge, if your site is made by JavaScript (a well-known programming language), you only need to copy a JavaScript snippet and paste it to the head tags of those webpages that you want to track individually. If your site is run by third-party website builders like GoDaddy or WordPress, the whole method is the same, as these are all programmed with JavaScript language. If you pasted this little snippet, you have no other task to look at. You heard right, that’s it.
What can these tools track?
You’re probably wondering what these tools do since the term “visitor behavior” can encompass various actions.
- Can they monitor users via webcams?
- Do they have access to personal information?
- Are there legal issues with allowing these recordings?
No, none of these. Understanding user behavior doesn’t entail knowing their age, location, or personal activities.
⚠️ In fact, access to this personal data is prohibited by GDPR and CCPA regulations, which aim to safeguard online users’ privacy.
To comply with these regulations, many website analytics companies have implemented data masking to protect sensitive information from being compromised or accessed by unauthorized individuals. We have also written an article on this very important topic, so if you are also interested, we recommend that you explore it further. These data analytics tools aren’t designed to access sensitive information. Instead, they focus on analysing other aspects of website performance, and I’m happy to show you what these include.
Clicks, and taps
Understanding where your visitors tap and click on your webpages provides a wealth of valuable information. How many clicks do they make on different call-to-actions? Where do they navigate from the landing page? And do they encounter any bugs along the way? All this data is waiting for you to uncover.
Many data analytics tools can also track “rage clicks,” which are repeated clicks in a short time frame. This behavior may indicate general dissatisfaction with an element on your page, possibly due to a bug or a complicated website navigation system.
U-turns are another important aspect of click analytics. This happens when a visitor visits the page and suddenly returns. While the reason may vary depending on the context, it sometimes indicates dissatisfaction, confusion, or poorly placed website elements and CTAs.
Scrolling
If you get access to how many of your visitors scroll down on some of your pages, you also know a little bit more about them. Scrolling often indicates engagement. A high scrolling rate on a webpage suggests that many visitors are reading the content thoroughly because they find it valuable and worth their time. This data can help you identify which webpage elements, content formats, and picture-to-text ratios need adjustment to improve performance.
However, how far users scroll down usually depends on other circumstances itself. Different types of webpages can reach different scrolling behaviors (blog content may lead to more scrolls, more than the landing page). Also, different industries may experience changes in their customer’s scrolling statistics. Before you start to worry, always check industrial statistics, or your rival’s data, to be sure that the blame is on you. Moreover, fewer scrolls don’t necessarily equate to less engagement. While this is a common assumption, it’s essential to corroborate it with other analytics methods.
Mouse movement
Like analyzing your visitor’s mouse movements. It may also lead you to very crucial data. Mouse movement shows you where your visitors place their mouse on your website’s display while browsing your site.
While mouse movement alone may not indicate much, it typically occurs for a reason, according to research. Users often use their mouse to follow their gaze on the screen, helping them keep track of their position. Therefore, mouse movement analytics can show us what visitors are focusing on and which parts of our webpages they find uninteresting.
Examples of uses
There are numerous types of online analytics tools, including A/B testing tools, heatmap tools, session recordings, form analytics, and traditional website analytics tools. Listing all of them would take considerable time and effort.
However, I’ll delve into the details of the four most crucial types:
Traditional website analytics
Traditional website analytics tools offer general metrics such as the number of unique visitors, bounce rates, conversion funnels, and session durations. Capturly Analytics provides these features along with some additional key metrics.
Our traditional website analytics are available on our “dashboard” hub, as you will see that we have some other useful options. Our dashboard function not only tells you the data that I mentioned earlier, but we also have some other unique or rarely used features across the data analytics industry.
We provide a calendar function where you can specify time intervals to analyze trends across different periods. Whether you want to track sessions, pageviews, average session lengths, bounce rates, or conversion rates for a specific date range or day, there are no limitations. On the “dashboard” page you get to know some highlighted parts about our other features, but it comes a little later.
Heatmap analytics
Heatmap analytics provides visual representations that summarize how users behave in various scenarios using warm and cold color changes. With the help of this technique, you can understand trends, and correlations, and figure out how the majority of your customers think of your site.
This tool visually represents the customer’s clicks, scrolls, or sometimes mouse movements. Our tool, Capturly Analytics can show you both your customer’s clicks and scrolls on unlimited pages.
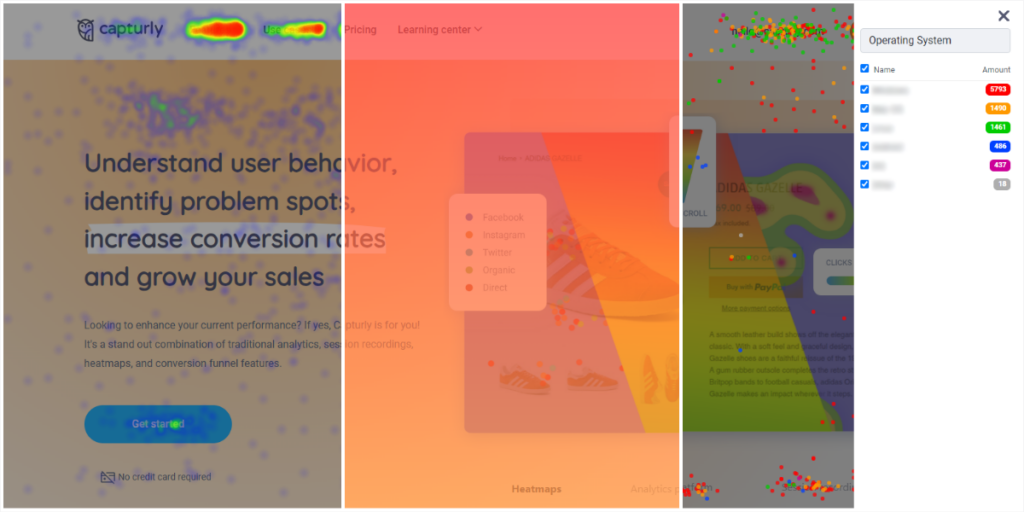
Capturly click, scroll and segment heatmaps
But I can tell you some more. We offer a unique “segment heatmap” besides these two opportunities. Unlike other heatmaps, the segment heatmap doesn’t create a separate heatmap for each tracked behavior. Instead, it helps organize your data and detect correlations specific to certain segments of your visitors.
This segment heatmap function segments these clicks, and scrolls based on five different factors:
- Referrer
- New vs returning visitors
- Operating system
- Browser
- Device
Inside these factors, you can click on the individual possibilities, which you can either want to visualize or not. After you click on those types you want to have a closer look at, the program only shows you those clicks and scrolls that pass your requirements. This way, you can detect bugs that only affect a portion of your visitors. You don’t want to lose anybody, do you?
Session recording analytics
Session recording analytics is the key feature of website analytics tools nowadays. It allows users to record and replay individual sessions from their visitors’ activity on their site. With session recording, you can observe almost everything your website visitors do, including their paths, clicks, interactions with search bars, and any text they input on your site (excluding sensitive information like credit card details and passwords). Once visitors accept cookies, the recording begins and continues until they leave the site or become inactive for a set period.
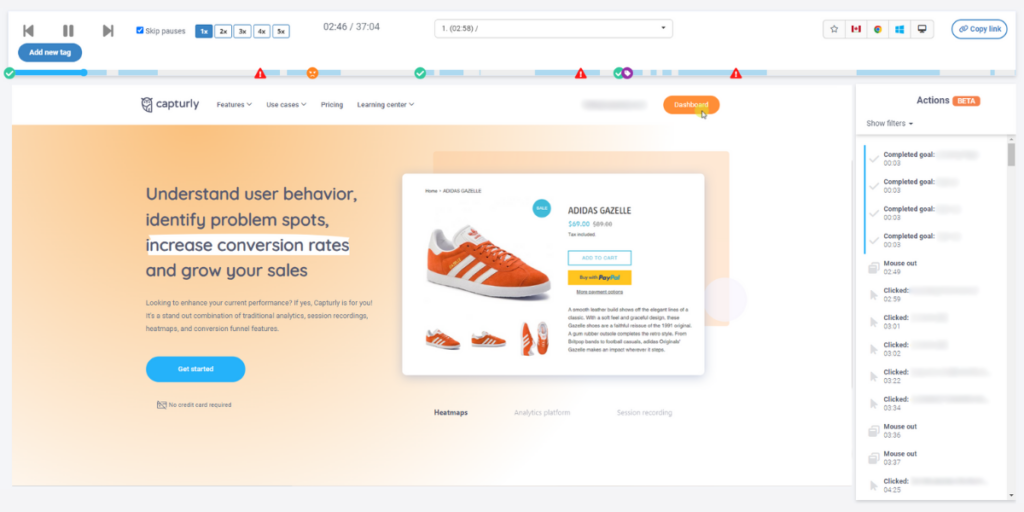
Capturly session recording
The greatest thing about this function is it handles visitors one by one. If one of your potential buyers gets stuck, with the help of these sessions you can provide him with complete plans, and simple problem-solving. Plus, it can assure you about the hypothesis that either your heatmap or traditional website data analytics stated earlier.
Capturly Analytics doesn’t only provide you with session recording software, but with the help of that, you can get access to many great features as well. A wide range of filtering options, and behavior trackers, just like rage-clicks, and U-turns, which we mentioned earlier. On top of that, we track 6 types of JavaScript errors, which basically covers all of them. And I haven’t spoken about our live recording function yet, which enables us to give real-time solutions to real-time problems.
Survey analytics
Survey analytics is one of the latest examples of behavior analytical measurement. Nowadays, site-based questionnaires are more popular than ever as they facilitate deeper connections between companies and customers. These forms encourage visitors to share their opinions more frequently and motivate them to express any negative experiences related to products, websites, or the company itself. The returned surveys help the company to focus on their weaknesses, but not just these can help them figure out information about their customers’ thoughts.
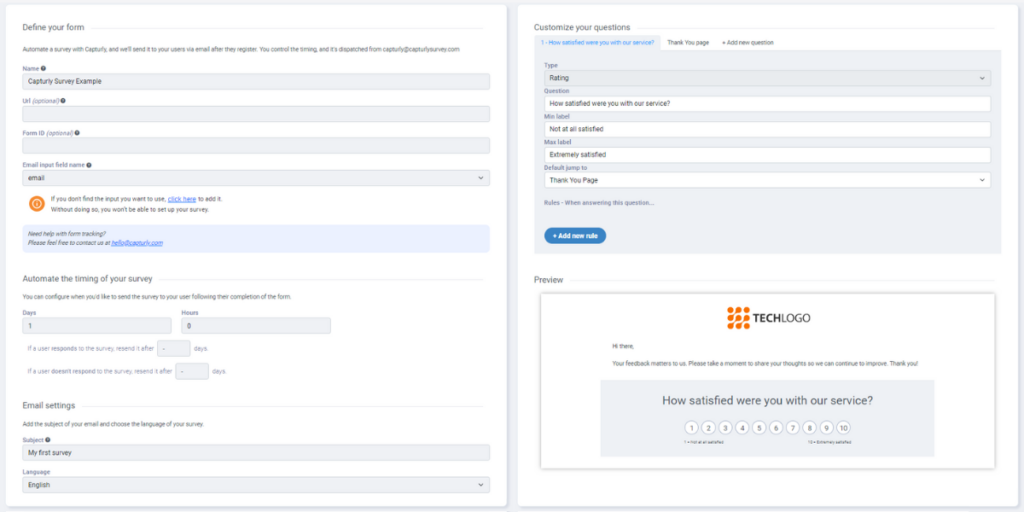
Capturly email survey
Behavior analytics tools offer you survey options, which not only help you to create on-site questionnaires but help you analyze the given data also. With Capturly’s new function, you can create infinitive surveys, and get statistical data from the given answers, like mean score, average score, or conversions between the stages of the form. In addition, Capturly’s session recording is integrated with our form analytics, allowing you to observe individual form completions or incompletions.
Conclusion
The field of behavior analytics tools is expanding rapidly, driven by increasing demand.
Numerous studies conducted over the years have demonstrated that the ethical and proper use of these tools generally leads to greater success for companies. A strong customer-company relationship is crucial in online B2C sales, and behavior analytics helps identify any issues or areas for improvement in this relationship. With dedicated time and financial resources, you can create a website that fulfills your potential buyers’ desires.
Don’t forget, the customers are not for you, you are for the customers. They will find other companies to buy their desired needs, but it takes more and more money for you to search for other prospects.
1 Comment
Retro bowl
2024-03-21 at 05:25Your writing is intriguing to read. This is an excellent document for me.