It’s 5% for everyone. No, just kidding, if only it was that simple, though. In fact, there are tons of different factors telling what exact conversion rate would be ideal for your business.
But don’t dive in too deep just yet. As of now, you might be aware of what conversion rate means, however, it’s still no harm in revising its definition. So thanks for doing that for me… Ah, okay so it shows you how many of your target audience actually take your desired action. Given the number of total visitors, you can easily sort it out after realizing the number of conversions.
And the reason why you need to improve it is obvious. It’s because in order to crank up your numbers in revenue, you must focus on conversions first, and then traffic. Now, you see, many business owners think that the more people they reach, the more income they can produce. As a matter of fact, traffic is no longer (not likely if it ever was) a key metric to your business success.
Table of Contents
What is the conversion rate?
Measuring your e-commerce conversion rates is crucial for true success. It’s because if you don’t measure your results, how do you know what’s working well and what you need to improve? Even if your website already converts well, paying attention to optimizing its conversion rate could result in more sales than you ever imagined. Discover your business’s potential and make the most of it.
What does a conversion rate mean?
The conversion rate is an important KPI (Key Performance Indicator), calculated as a percentage by dividing the total conversions by the total number of visits. Conversion refers to any action we want users to take on our website, like signing up, making a purchase, or filling out a form.
How is the conversion rate calculated?
You can calculate the conversion rate by dividing the number of conversions by the total number of visits in a given period.
💡 Here is an example: You get 100 users from your Facebook ad to visit your site, and only 3 of them make a purchase. In this case your conversion rate will be 3%, because you should divide 3 by 100.
Why conversion rate is important?
If you’re not measuring your conversion rate, you’re missing a big opportunity to understand your audience and improve your business. As long as you’re aware of your customers’ intentions, until then unknown ideas will open up for you. Measuring conversion rates will help you measure the success of your business. However, you need to come up with a benchmark figure for your own market. But what is the ideal number for your industry?
What impacts the ideal conversion rate?
I cannot tell you a universal benchmark figure that applies to every sector, but I can give you many hints so that you can find out what number works best for you.
Many factors can play a role in determining that ideal value, such as:
- industry
- level of competition
- type of product
- your customers
- source of traffic
- device (desktop, tablet, phone)
- location
- price or average order value
As you might have guessed, low-ticket products are easier to sell, therefore you must target a higher rate. On the contrary, in the case of high-ticket items, a lower number of sales are fair enough to make a decent income.
What is a good conversion rate?
Conversion rates vary wildly between industries, with some industries converting only 1% of their visitors to customers, while others sell 10% or more of their visitors’ first-time purchases. But you could say that the average rate is around 2.35 percent among all industries. That’s a good starting point.
How to find the conversion rate that’s good for you?
You can easily find a good conversion rate that suits your industry and your business. Analyze your environment, research your competitors, analyze your past experience and continuously drive change. Every business has a different good conversion rate. Be patient and find your own.

Food & Beverage
The food industry is based on essential needs, so there will always be a demand for it, especially for basic foods. Since the food market is diverse, the conversion rates may vary. More people will buy everyday items like pasta than luxury brands. Therefore, it’s important to consider the market diversity when calculating the average conversion rate.
Based on Statista, the Food and Beverage industry’s average conversion rate stands at 3.1%. However, according to LittleData’s survey, the average rate is lower, at 1.5%. Nevertheless, a conversion rate of 4.1-6.2% is even possible in this industry. The chart below illustrates how the Food and Drink industry’s average conversion rate has evolved over the past 5 years.
Average conversion rates in the Food and Beverage Industry over the years (2018-2023)
Here’s the change of the average conversion rate in the Food and Beverage Industry over the years: 2018 Q3-Q4: 0.78%, 2019 Q1-Q2: 1.04%, 2019 Q3-Q4: 1.08%, 2020 Q1-Q2: 1.90%, 2020 Q3-Q4: 2.01%, 2021 Q1-Q2: 1.83%, 2021 Q3-Q4: 1.97%, 2022 Q1-Q2: 1.38%, 2022 Q3-Q4: 1.59%, 2023 Q1-Q2: 1.29%.
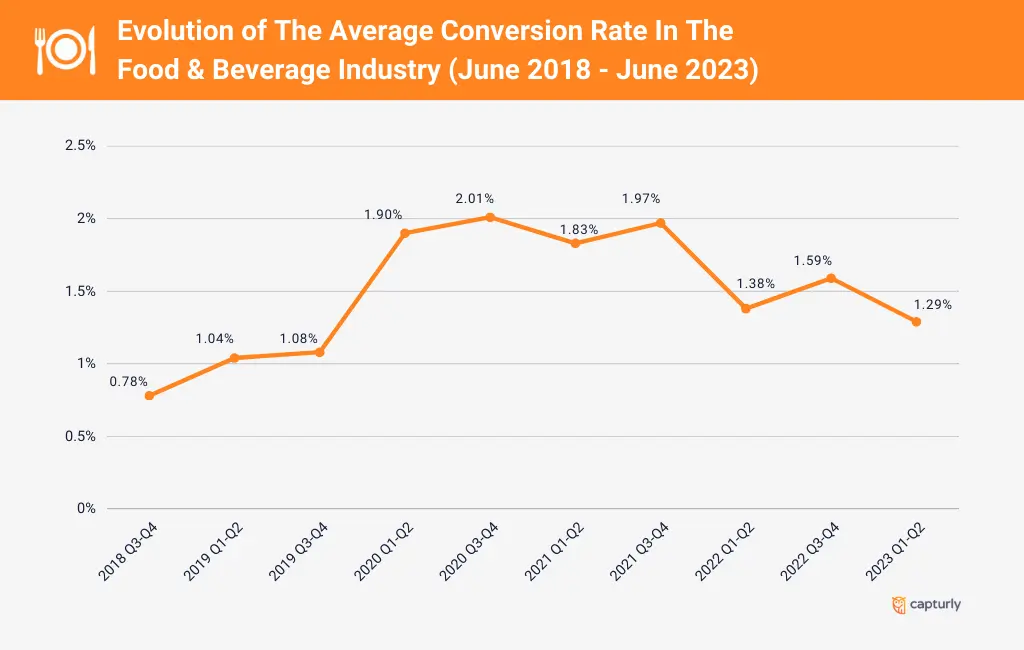
The Covid-19 pandemic in 2020 has significantly transformed the market, leading to an increase in online food ordering. While some shoppers have returned to in-person shopping, many others who value convenience continue to choose online shopping.
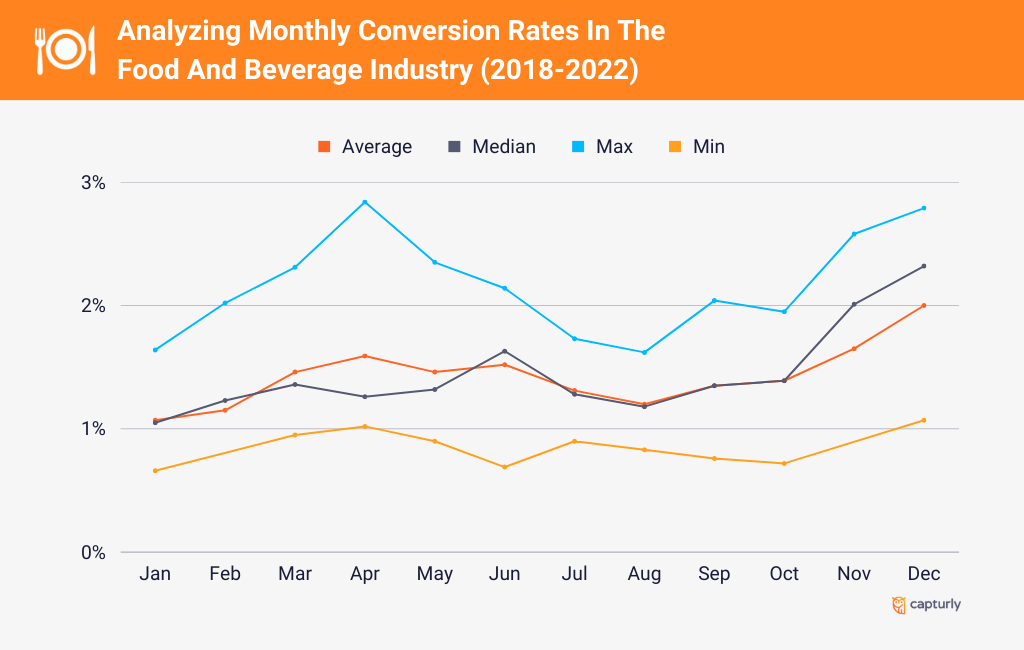
Monthly conversion rate statistics for Food and Beverage Industry (2018-2022)
From the data of 2018-2022, you can observe how the average, median, highest, and lowest conversion rates change each month throughout the year.
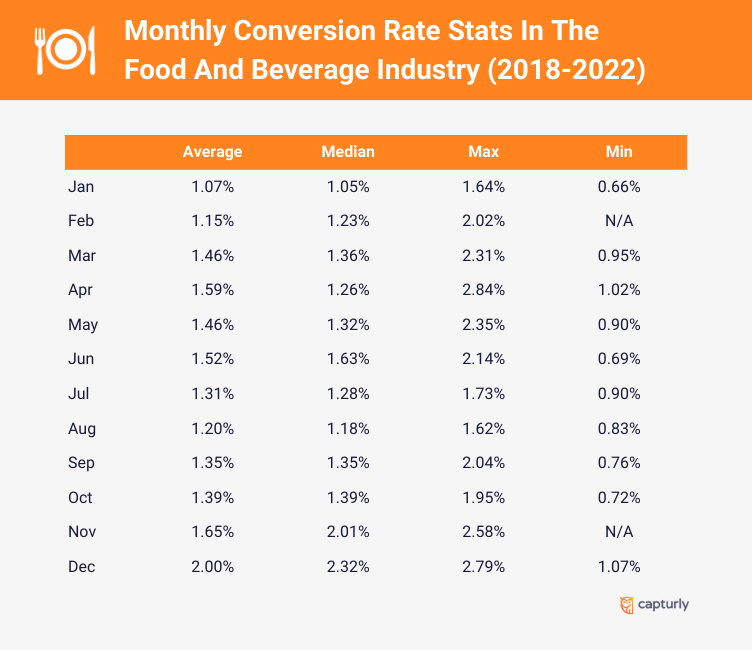
Drawing from our past experience, it’s no surprise that the Christmas holiday season reigns as the peak period for the Food and Beverage Industry, boasting an impressive average conversion rate of 2.00%. In more recent times, the April-June period has also shown promising results, achieving a higher conversion rate of 1.59%. However, we must consider the potential impact of the 2020 coronavirus outbreak and subsequent quarantine period, which compelled many to opt for food delivery services. This unprecedented situation could have influenced the figures during that time.
Summary
As you can see, the conversion rate can fluctuate based on various factors such as the year, time period, product, or service. As a result, there’s no fixed percentage you must achieve. It’s essential to customize your goals and determine what constitutes a favorable conversion rate for your specific circumstances. According to Growcode, achieving a conversion rate of 7.24% in the Food & Drink industry would put us in the top 25% of companies in this sector. However, it’s worth noting that the median conversion rate currently stands at 3.58%. Achieving this can be a good starting point, as it can provide a secure starting point.

Healthcare
Healthcare will always be in demand. There will always be people who are sick or want to stay healthy. That’s why the healthcare sector can expect a consistently high conversion rate if it can reach your target audience.
As per Statista, the average conversion rate in the Health and Beauty stands at 2.9%, a number that aligns with Ruler Analytics‘ findings of 3%. Hubspot suggests that aiming for a rate between 1.87% and 4.20% is a good target. This value varies based on the given service. Now, let’s review the results from the past few years:
Average conversion rates in the Healthcare Sector over the years (2018-2023)
Here’s the change of the average conversion rate in the Healthcare Sector over the years: 2018 Q3-Q4: 2.44%, 2019 Q1-Q2: 3.07%, 2019 Q3-Q4: 3.12%, 2020 Q1-Q2: 4.04%, 2020 Q3-Q4: 3.47%, 2021 Q1-Q2: 3.28%, 2021 Q3-Q4: 4.00%, 2022 Q1-Q2: 3.44%, 2022 Q3-Q4: 3.81%, 2023 Q1-Q2: 3.80%.
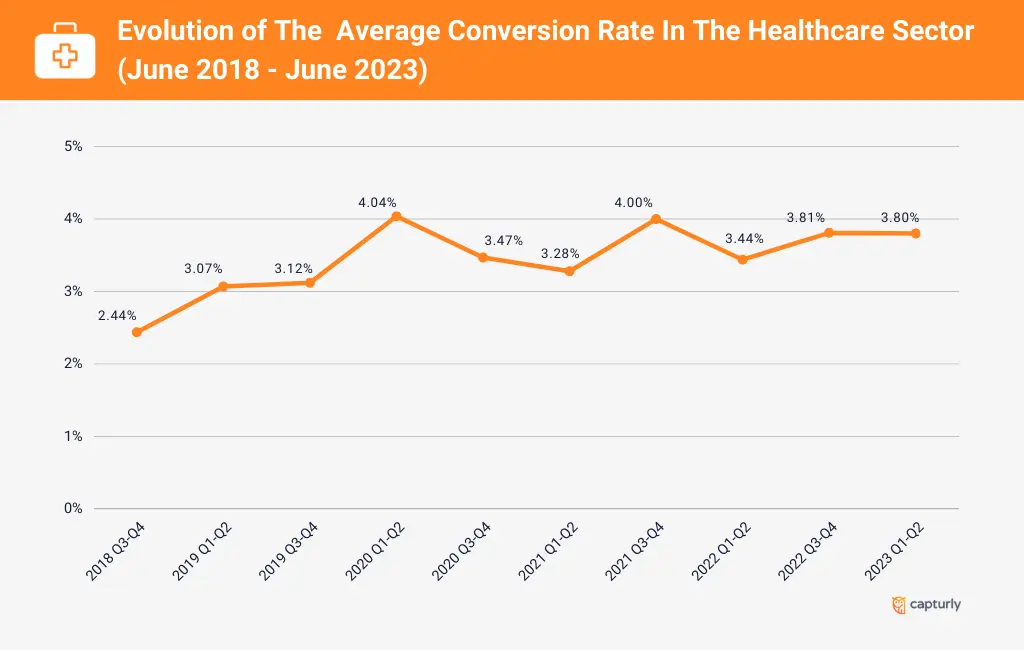
The latest trends show that e-commerce conversion rates in healthcare are rising significantly. In 2018, the average conversion rate stood at 2.51%, but as of June 2023, it has surged to an impressive 5.40%. We look forward to seeing further developments in the future and how this rate will continue to improve or decline.
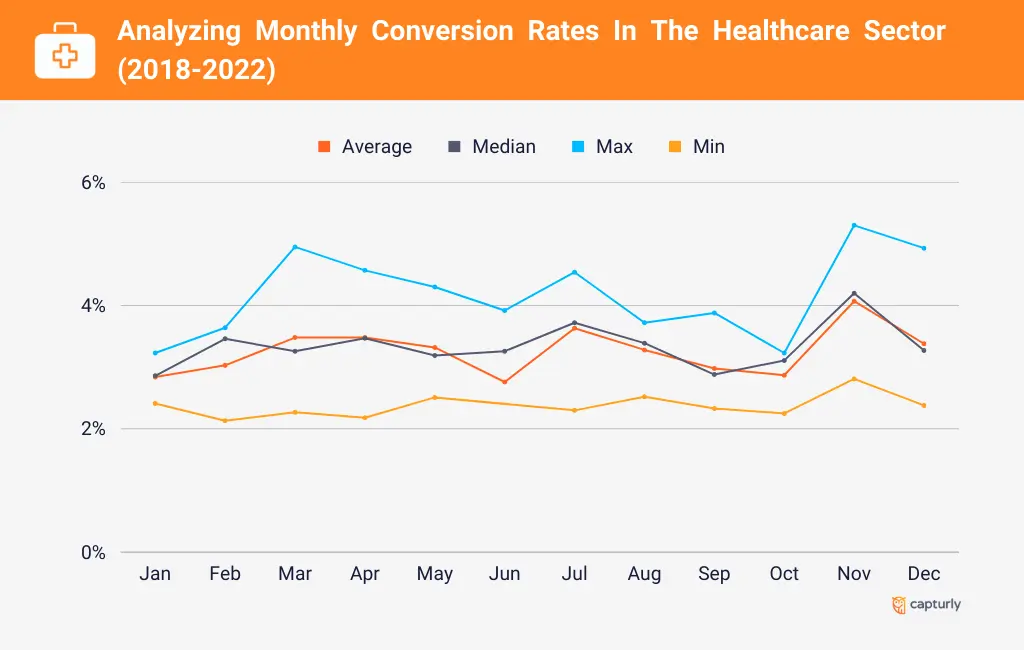
Monthly conversion rate statistics for Healthcare Sector (2018-2022)
By analyzing the data collected from 2018 to 2022, the monthly fluctuations in the average, median, highest and lowest conversion rates can be tracked for each year.
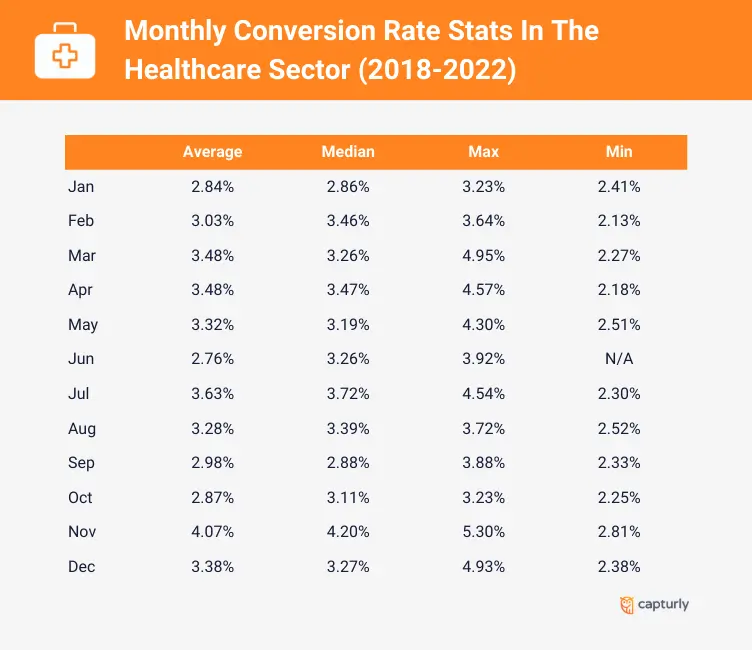
When we look at data from previous years, it’s interesting to note that the healthcare sector stands out from other industries. Unlike the significant spike seen during the Christmas period elsewhere, the healthcare industry experiences its peak when the colder seasons roll in, with the conversion rate soaring up to 4.07%, as compared to more recent times. Additionally, we might observe higher conversion rates during the summer and spring months. However, it’s crucial to bear in mind that these figures could be influenced by the heightened demand for healthcare services and products during the 2020 coronavirus epidemic.
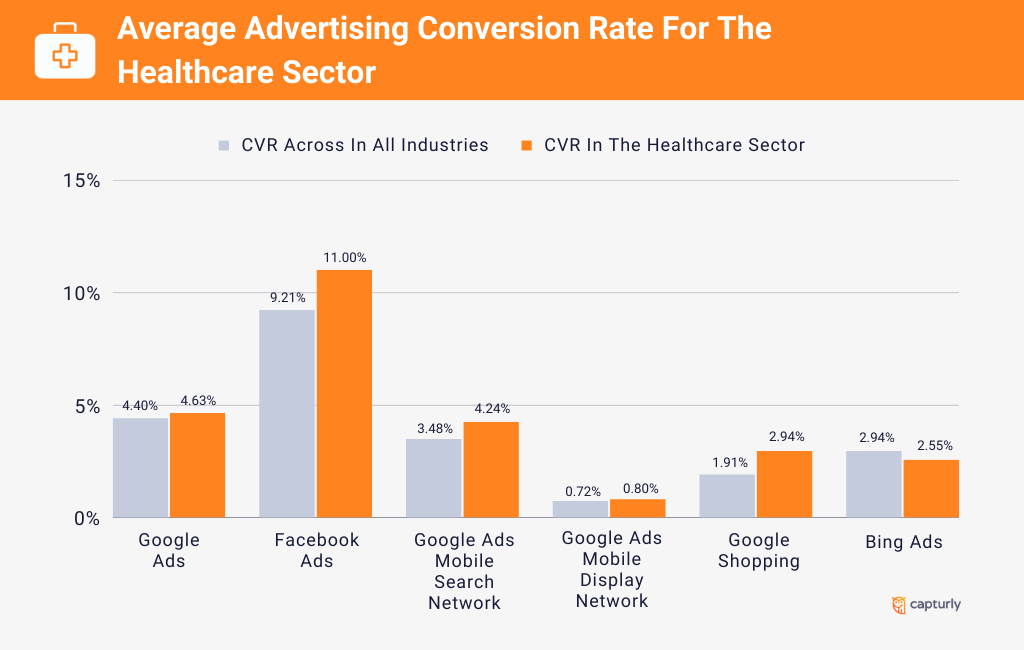
Average advertising conversion rate for the Healthcare Sector
💡 Did you know? 5% of all Google searches are health-related.
The impact of online advertising in the health industry is truly remarkable, as highlighted by WordStream’s findings. Facebook Ads stand out with an impressive 11% conversion rate, surpassing the average. Following closely behind, we have Google Ads, expected to deliver an above-average conversion rate of 4.63%. Notably, Google Mobile Ads, including Search Network Ads, also secured a commendable spot on the podium, achieving an above-average conversion rate of 4.24% in the survey.
Summary
As per Growcode, attaining a conversion rate of 5.24% would position us within the top 25% in the Health & Beauty industry. Based on their survey, the industry’s median e-commerce conversion rate currently stands at 3.08%. Achieving this milestone could be considered a perfect “golden mean” for you.

Apparel
Starting your own clothing brand can be a great idea because there’s nothing cooler than having your own collection. Whether you’re a designer or a retailer, industry trends affect everyone. Since the clothing industry is vast, the conversion rate can vary significantly.
Based on Statista’s data, the clothing sector typically experiences an average conversion rate ranging from 0.8% to 2.3%, depending on the type of product. However, LittleData’s survey indicates a slightly higher average of 1.9% on desktop, with the potential to reach even more impressive figures of 4.3% or even 6.1%. It’s essential to note that venturing below a 0.4% conversion rate may not yield desirable results. The chart below validates these findings, affirming the accuracy of the mentioned figures within this market.
Average conversion rates in the Clothing Industry over the years (2018-2023)
Here’s the change of the average conversion rate in the Clothing Industry over the years: 2018 Q3-Q4: 1.42%, 2019 Q1-Q2: 1.32%, 2019 Q3-Q4: 1.57%, 2020 Q1-Q2: 1.84%, 2020 Q3-Q4: 1.90%, 2021 Q1-Q2: 1.93%, 2021 Q3-Q4: 1.87%, 2022 Q1-Q2: 1.55%, 2022 Q3-Q4: 1.85%, 2023 Q1-Q2: 1.54%.
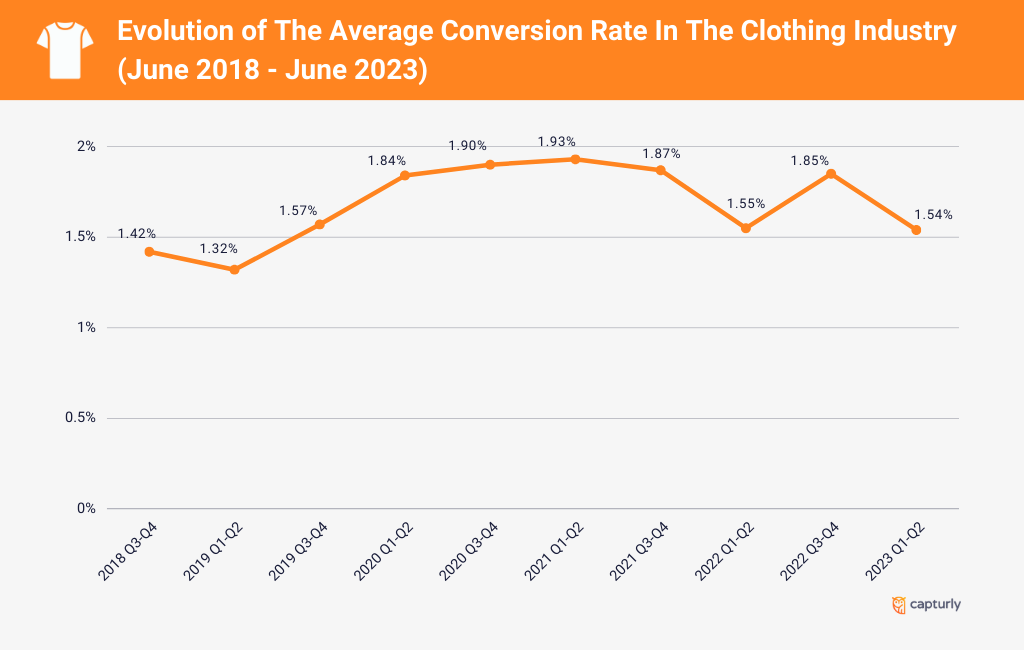
Just like in many e-commerce industries, the clothing sector experienced a positive impact on conversion rates after the year 2020, but no drastic changes have been observed. Nevertheless, it’s important to reiterate that the average conversion rate is heavily influenced by whether we are dealing with low-ticket or high-ticket products.
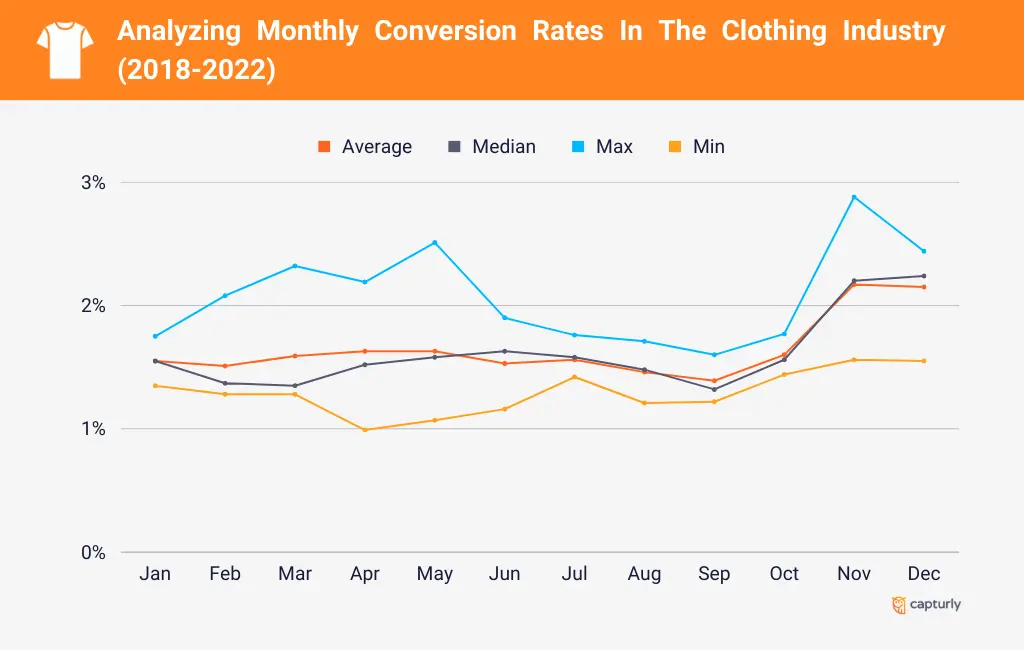
Monthly conversion rate statistics for Clothing Industry (2018-2022)
By analyzing the data spanning from 2018 to 2022, one can track the monthly fluctuations of the average, median, highest, and lowest conversion rates over the course of each year.
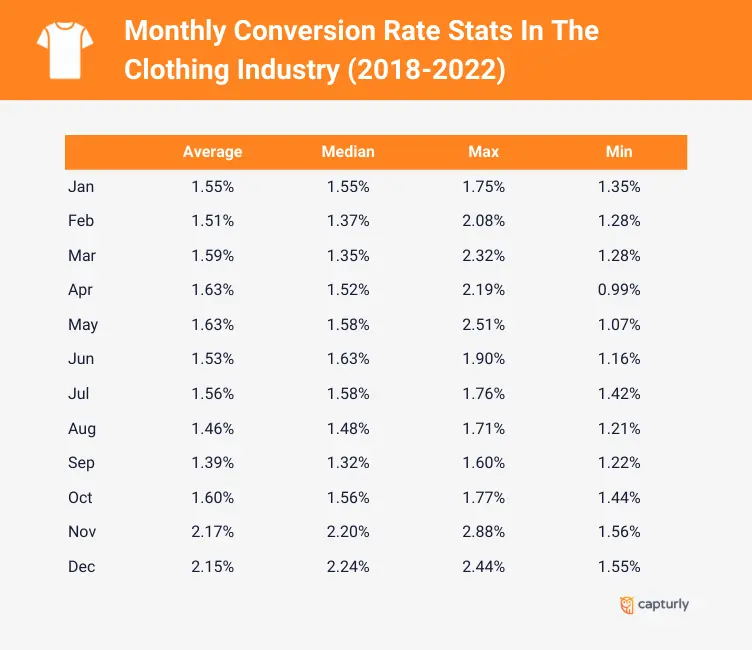
In the Clothing Industry, the summer and Christmas seasons play a prominent role in business growth. Conversion rates fall as the summer winds down, but you can make the most of your business with Black Friday in November. The first quarter of the year may be more difficult as the Christmas rush is over, but this period gives you time to prepare for the summer dumping.
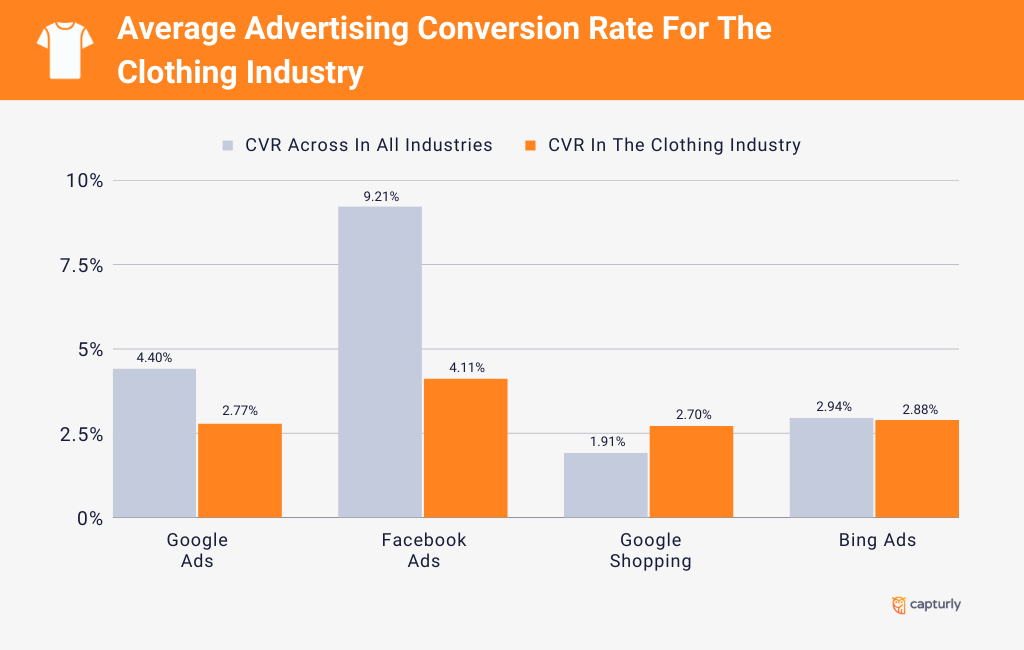
Average advertising conversion rate for the Clothing Industry
If you’re considering advertising in the apparel industry, WordStream suggests that placing your focus on Facebook Ads could be a winning strategy, as it boasts the highest average conversion rate of 4.11%. Following closely behind are Bing Ads at 2.88% and Google Ads at 2.77%. While these statistics are valuable when selecting an advertising platform, it’s essential to keep in mind that the paramount factor is reaching your target audience effectively. Therefore, if your consumers predominantly use Google, don’t hesitate to explore advertising on Bing, but always prioritize reaching your audience where they are most active.
Summary
According to Growcode, the Clothing and Fashion category’s top performers can achieve conversion rates as high as 3.27%, placing them within the top 25%. By comparison, the median conversion rate for the sector is 1.96%. Achieving such a rate would already be considered commendable within this industry.

Electronics
If you’re planning to sell electronics online, get ready for some unexpected conversion figures. Some people may be a little hesitant about buying electronics online because they fear the quality. This is particularly true when it comes to higher-priced products. This mistrust can cause the average conversion rate to be not so high.
Based on Statista, Electronics and Accessories have an average conversion rate of 1.7%, while Home Appliances only reach 1.4%. Hubspot reports that Electrical and Commercial Equipment has an average conversion rate of between 1.31% and 2.49%. The chart below illustrates the changes in the average conversion rate for products in the Electrical and Commercial Equipment category over the last 5 years.
Average conversion rates in the Electronics Industry over the years (2018-2023)
Here’s the change of the average conversion rate in the Electronics Industry over the years: 2018 Q3-Q4: 2.83%, 2019 Q1-Q2: 2.33%, 2019 Q3-Q4: 1.86%, 2020 Q1-Q2: 1.69%, 2020 Q3-Q4: .1.79%, 2021 Q1-Q2: 1.55%, 2021 Q3-Q4: 1.37%, 2022 Q1-Q2: 1.37%, 2022 Q3-Q4: 1.17%, 2023 Q1-Q2: 1.23%.
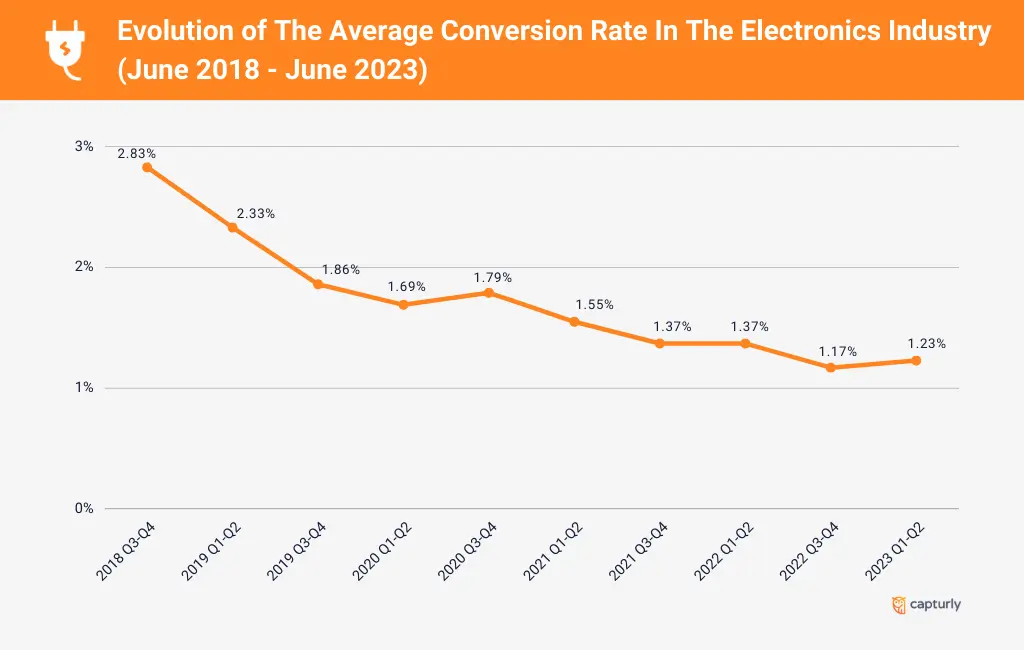
When it comes to electronics products, the conversion rate has been experiencing a year-on-year decrease. However, it is important to note that the results of the IRP Commerce surveys show a different trend when other data are taken into account. According to their data, the average order value and sales price are steadily rising.
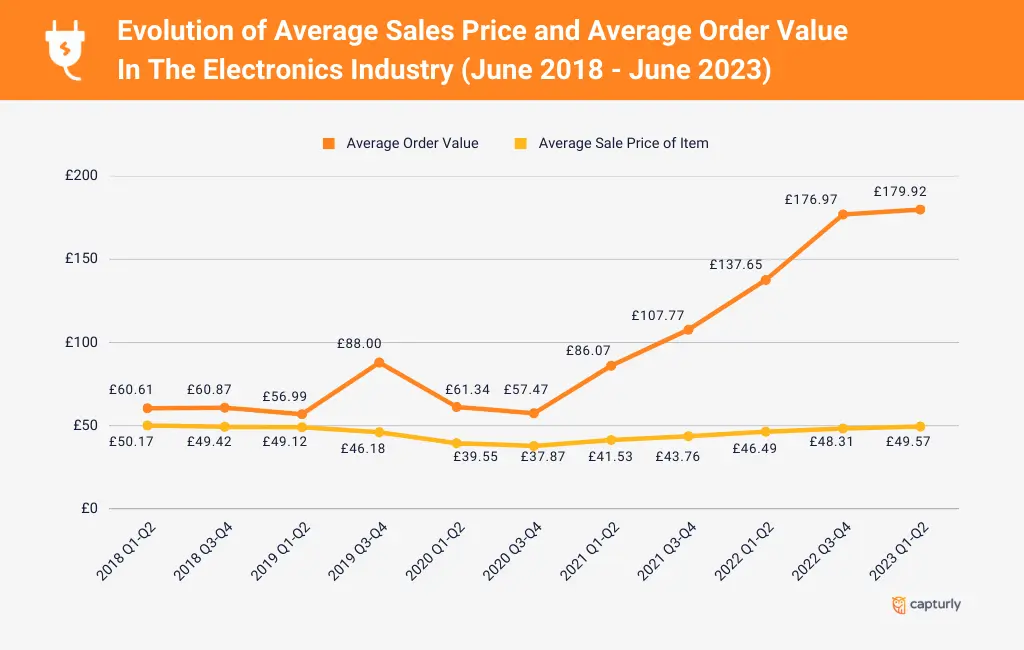
In fact, compared to last year’s figures in 2022, the average order value has seen a significant increase of 12.64%. Taking this into account, the conversion rate might experience a decrease due to the higher average order value and sales price. This is because both the product and order price play a significant role in influencing the conversion rate.
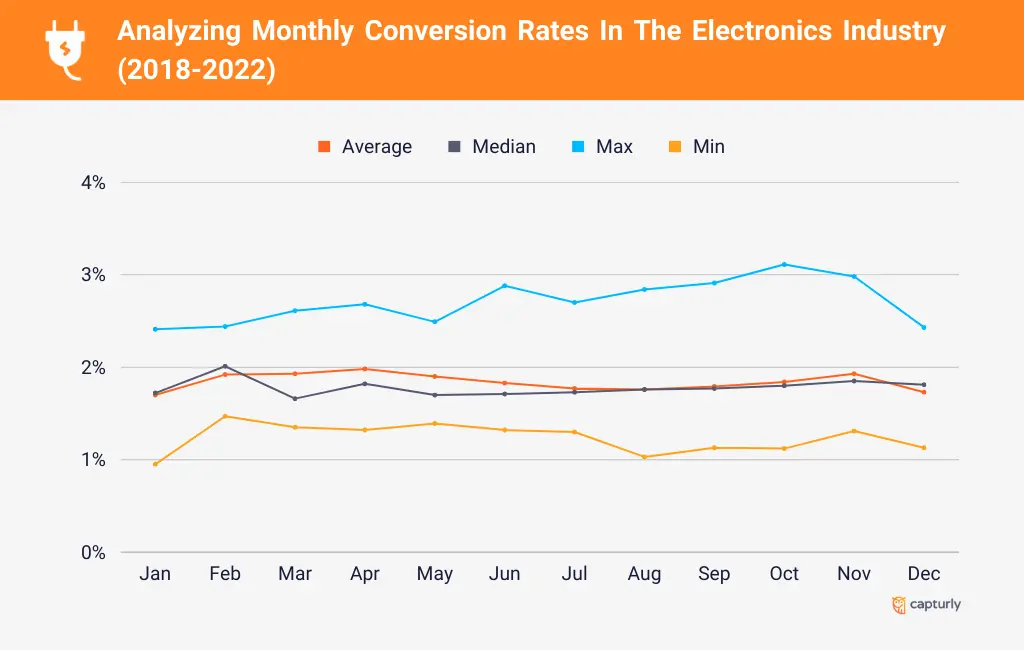
Monthly conversion rate statistics for Electronics Industry (2018-2022)
During the period from 2018 to 2022, an examination of the data reveals the monthly variations in average, median, highest, and lowest conversion rates over the year.
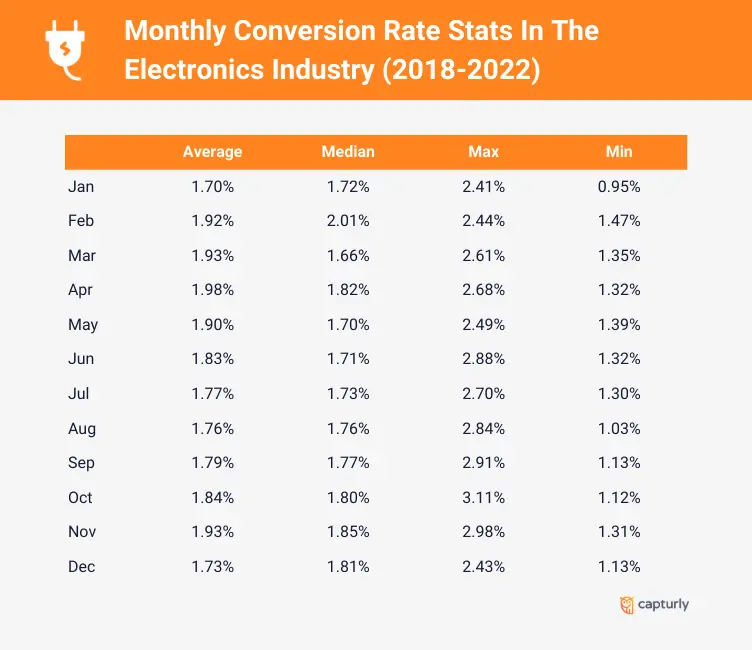
In the electronics industry, there is basically a constant demand for products all year round. Black Friday in November could boost the usual conversion. However, it is worth considering exactly what product you are selling, as you will obviously get the conversion rate increase at a different time for Christmas bulbs than if you are selling air conditioners in a continental climate where it is only warm in summer.
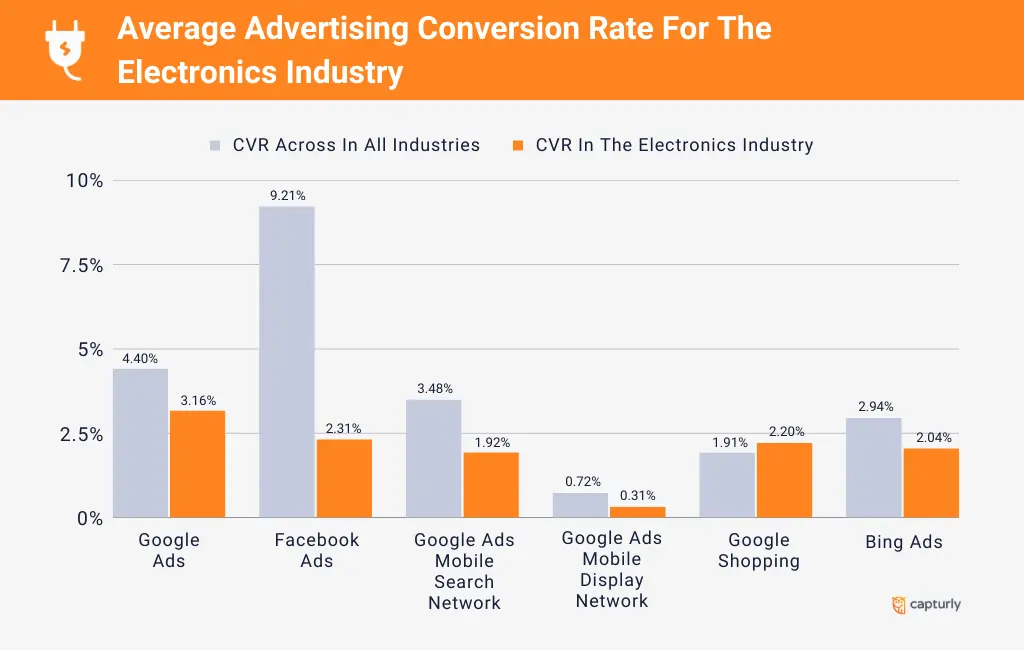
Average advertising conversion rate for the Electronics Industry
Choosing the right advertising space can be a challenge. WordStream reports that the top converting online advertising platform in the electronics industry is Google Ads, with an average conversion rate of 3.16%. This is followed by Facebook Ads at 2.31%, and Google Shopping in third place with a conversion rate of 2.20%. The next time you want to run an ad next time, you should take these figures into account.
Summary
Based on Growcode’s data, e-commerce players in the top 25% can achieve an impressive conversion rate of up to 2.42% in the Electronics category. While aiming for this figure is enticing, it’s worth considering the median, which stands at a more attainable 1.27%. Setting a reasonable initial target in this range may be a reasonable approach.

Pet Care
Did you know? 80% of pet owners today see their pet as part of their family. People adore their pets and are willing to go to great lengths to provide them with the finest care. Nevertheless, just like in any industry, factors such as price, quality, and even the characteristics of the animal itself play a significant role. Therefore, when gauging the average conversion rate, it’s essential to consider your individual circumstances.
Based on data from IRP Commerce, the average conversion rate in recent years has typically ranged from 1.33% to 1.81%. However, from 2023, this rate jumped significantly, reaching 2.01% in June. On the other hand, HubSpot reports a slightly higher average conversion rate, typically falling within the range of 2.20% to 2.53%.
Average monthly conversion rate in the Pet Care Industry in 2022
During the Christmas period, just like in many industries, the Pet Care Industry experiences the highest conversion rate. Incorporating the annual Black Friday event into your e-commerce business can prove to be beneficial since it’s a time when people actively engage in shopping.
💡 Fun fact: Did you know that there are approximately 145.9 million households in the US with some kind of pet? Out of these, a whopping 65.1 million households have a lovable canine companion, while 46.5 million households are proud owners of a charming feline friend.
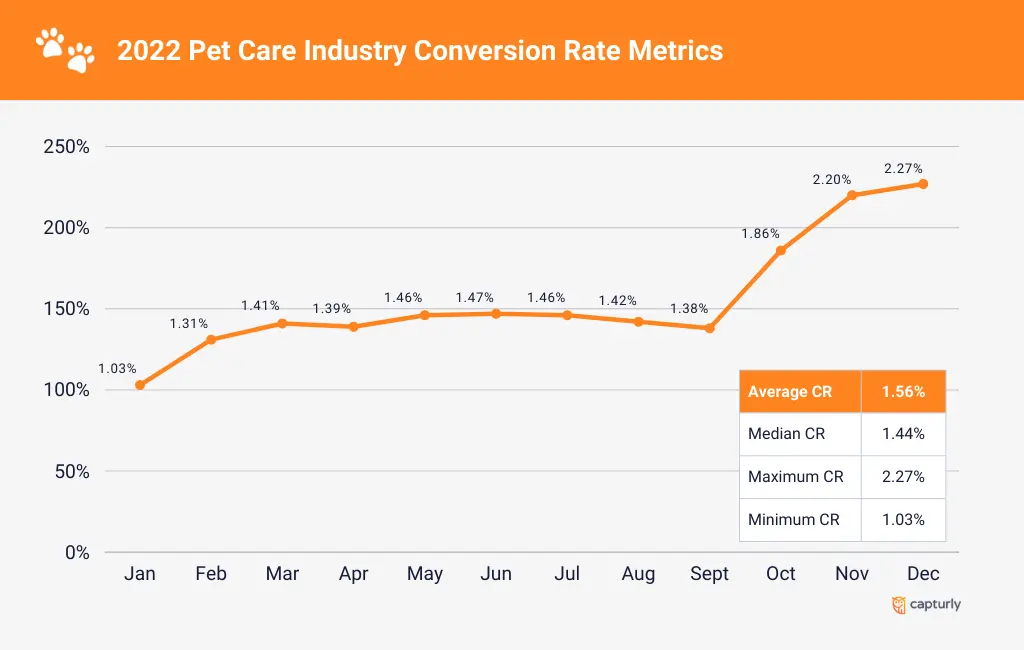
In 2022, the Pet Care Industry boasted an average annual conversion rate of 1.56%, with the maximum rate reaching an impressive 2.27%. The median conversion rate stood at 1.44%, while the lowest rate observed in January was still a commendable 1.03%.
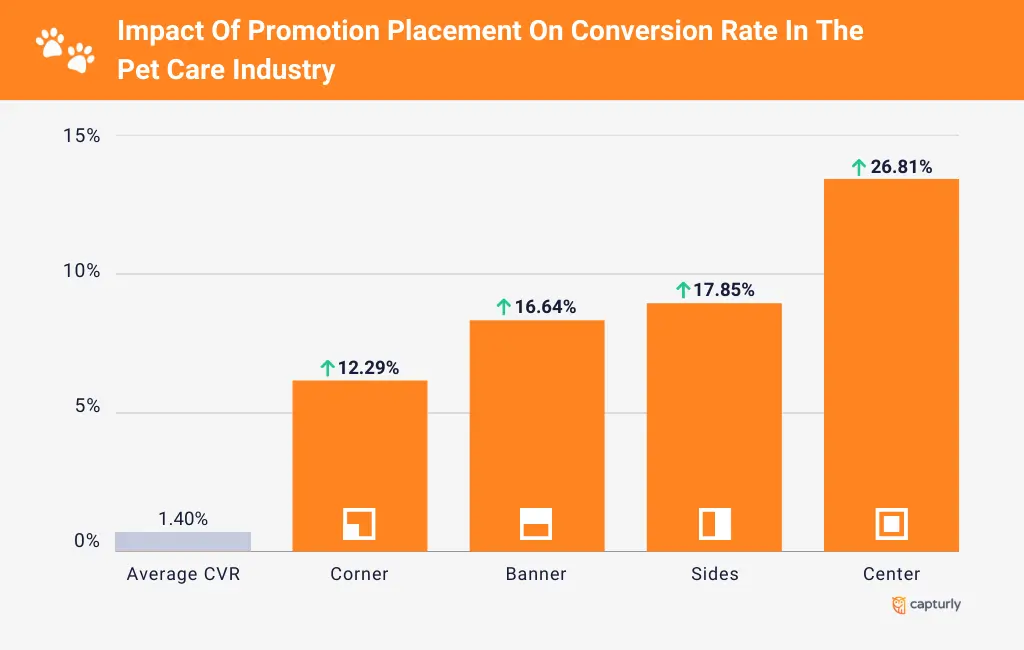
Effective ways to increase your conversion rate in the Pet Care Industry
JustUno suggests that optimizing your promotion can significantly boost the average conversion rate, which is currently at 1.4%. Depending on the placement, you can achieve higher rates. Placing the promotion in the corner results in a 12.29% conversion rate, while placing it in the banner yields 16.64%, and in the sidebar, it goes up to 17.85%. However, the most effective placement is in the middle, where the conversion rate reaches an impressive 26.81%.
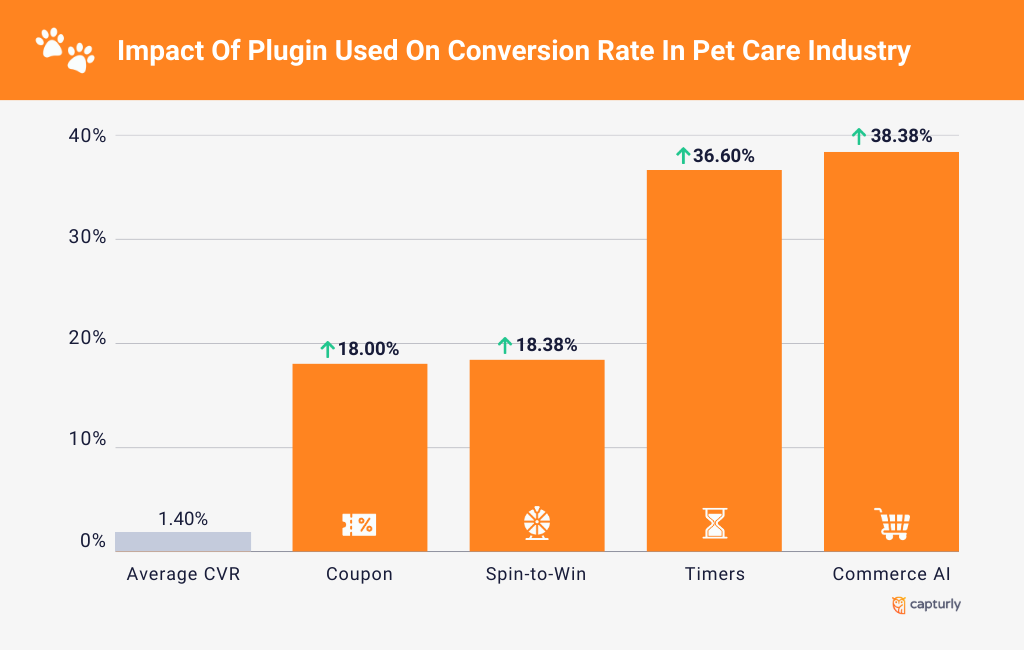
Additionally, the type of plugin used also plays a crucial role in conversion rates. For instance, using a coupon increases the rate to 18%, while spin-to-win achieves 18.38%. Implementing timers can boost the rate even further, to 36.6%, but the most impactful plug-in is commerce AI, which raises the conversion rate significantly to 38.36%.
Summary
In conclusion, aiming for a conversion rate of 1.5-2% is likely to bring positive results overall. To enhance these results, consider leveraging different promotional placements and using plugins strategically. Given that the market is growing, starting a pet webshop can be a wise decision, especially if you know how to create the perfect landing page.

Baby & Child
In the world of e-commerce, the Baby and Child Industry has historically shown lower conversion rates. It’s possible that this trend is influenced by the preference of many people to physically see the products before making a purchase. Additionally, brand loyalty plays a significant role, with consumers taking thoughtful consideration in selecting the perfect products for their little ones or as gifts for baby showers.
Based on statistics from IRP Commerce, the average conversion rate falls within the range of 0.81% to 1.07%. On the other hand, Hubspot reports a slightly different range of 0.87% to 1.43%. With these numbers in mind, would it be fair to settle on a friendly and rounded average conversion rate of 1.00%?
Average conversion rates in the Baby and Child Industry over the years (2018-2023)
Here’s the change of the average conversion rate in the Baby and Child Industry over the years: 2018 Q3-Q4: 0.76%, 2019 Q1-Q2: 0.73%, 2019 Q3-Q4: 0.83%, 2020 Q1-Q2: 1.12%, 2020 Q3-Q4: .1.25%, 2021 Q1-Q2: 0.89%, 2021 Q3-Q4: 0.90%, 2022 Q1-Q2: 0.82%, 2022 Q3-Q4: 1.12%, 2023 Q1-Q2: 0.86%.
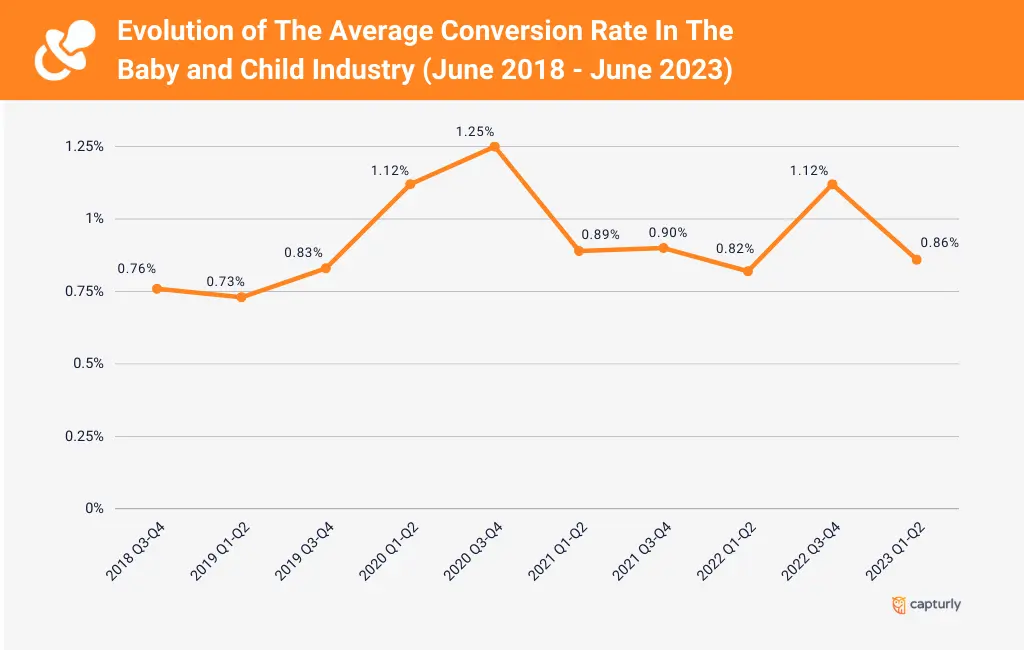
During Covid-19, the baby and children’s industry experienced a remarkable rebound, with an average conversion rate of 0.83% in the first and second quarters of 2019. However, things took a turn for the better in the Q3 and Q4 quarters of 2020, peaking at 1.25%. The growth has been truly impressive and it’s fascinating to see how the industry has flourished during this period.
This could be attributed to the shift of people towards online shopping instead of in-person visits. Although the average conversion rate has since eased back, there are still remarkable figures to celebrate, like the impressive 1.12% conversion rate observed in Q3 and Q4 of 2022. This indicates that the industry continues to show resilience and growth even in changing circumstances.
Monthly conversion rate statistics for Electronics Industry (2018-2022)
Throughout the years 2018 to 2022, an observable pattern emerges in the monthly fluctuations of average, median, highest, and lowest conversion rates.
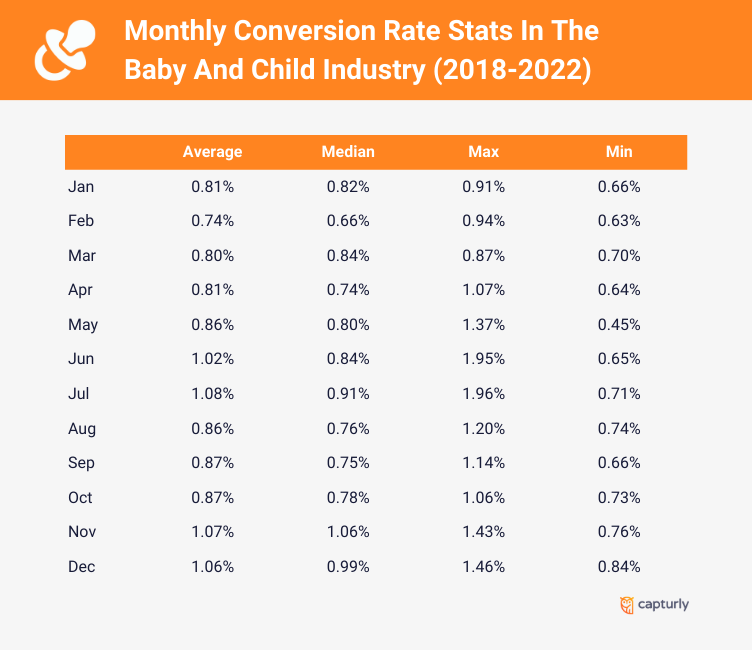
The baby and child industry has the lowest average conversion rate in this list. It is a difficult industry because it depends to a large extent on the exact country in which you sell your product. If you are trying to succeed in a place with an ageing population, you are likely to have fewer sales, but this also depends on the level of competition. If there are few, you can afford to sell fewer products at a higher price. Going back to the average conversion rate, clearly the Christmas and summer period is when you will see outstanding results.
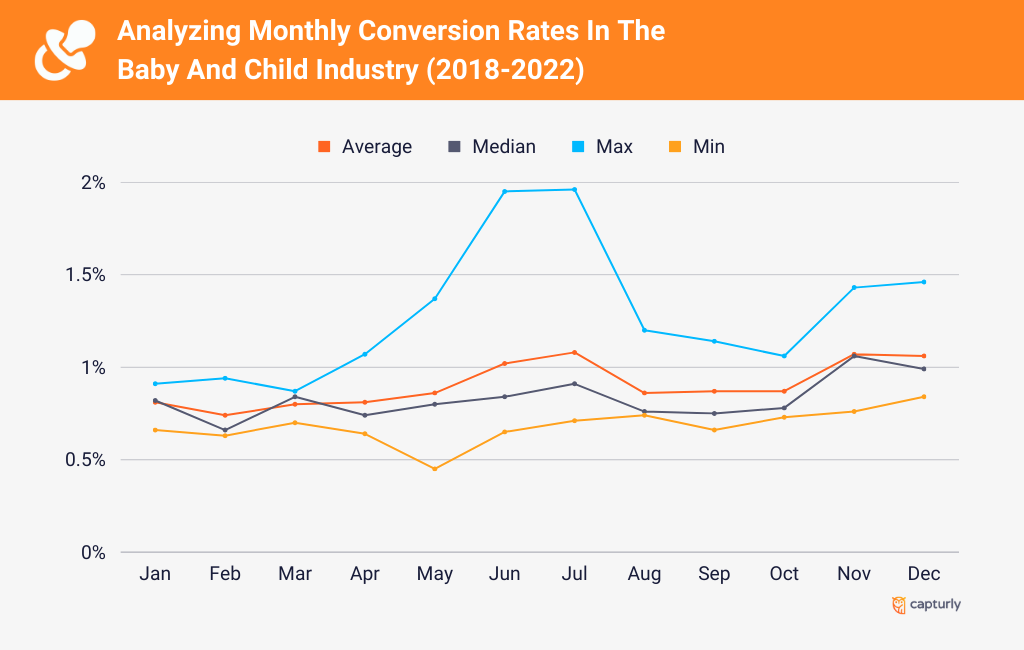
The surge in 2020 has definitely influenced the maximum conversion rate during the summer months. It’s worth noting that the summer season is a popular time for baby showers among new parents. By the way, here’s a fun fact: August happens to be the month with the highest number of babies born! This contributes to the popularity of the Baby and Child market, as the summer months, along with Christmas and Black Friday, tend to bring in high conversion rates. So, it’s no wonder this industry thrives during these times, drawing in both expectant parents and eager shoppers alike.
Summary
In conclusion, considering the statistics we’ve discussed, the average conversion rate hovers around 1.00%. However, it’s essential to keep in mind that this figure can see a boost during the summer months and winter holidays. Don’t be disheartened by the seemingly lower rate compared to other industries – success is still very much attainable. For instance, did you know that e-commerce stores in the toys, hobbies, and DIY categories achieved an impressive total sales of $105.6 billion in 2021? The key is to find your niche market and watch your business thrive.

Financial Services
The Financial Sector, much like any e-commerce business, boasts a remarkable diversity. A skilled professional can achieve an impressive conversion rate through well-targeted advertising, captivating content, and an optimized website. It’s fascinating to see how these rates can vary significantly across different sources.
Average conversion rate in the Finance Sector
According to Ruler Analytics, the average conversion rate stands at 3.1%. However, Unbounce’s report shows a notably higher average of 15.6%, with a median of 6.2%. Quite a spread, right? As the types of financial services and markets expand, so do the various average conversion rates. But let’s not stop there; there are other enlightening reports worth considering.
In Littledata’s 2022 survey, they found that Finance stores hold an average conversion rate of 0.2%. Their report suggests that achieving an average rate of 2.2% would place you in the top 20% of Finance stores, and if you go above 3.2%, congratulations, you’re already in the top 10%.
WordStream chimes in with additional insights, revealing that the median conversion rate in Finance is 5.01%. To break into the top 25%, you’d need a conversion rate of 11.19%, and to reach the coveted top 10%, an impressive 24.48% conversion rate.
It’s clear that success in the financial sector is within reach for those who harness the power of effective strategies and tailor them to their unique audience. With dedication and smart decision-making, you can achieve remarkable results and set yourself apart in this dynamic industry.
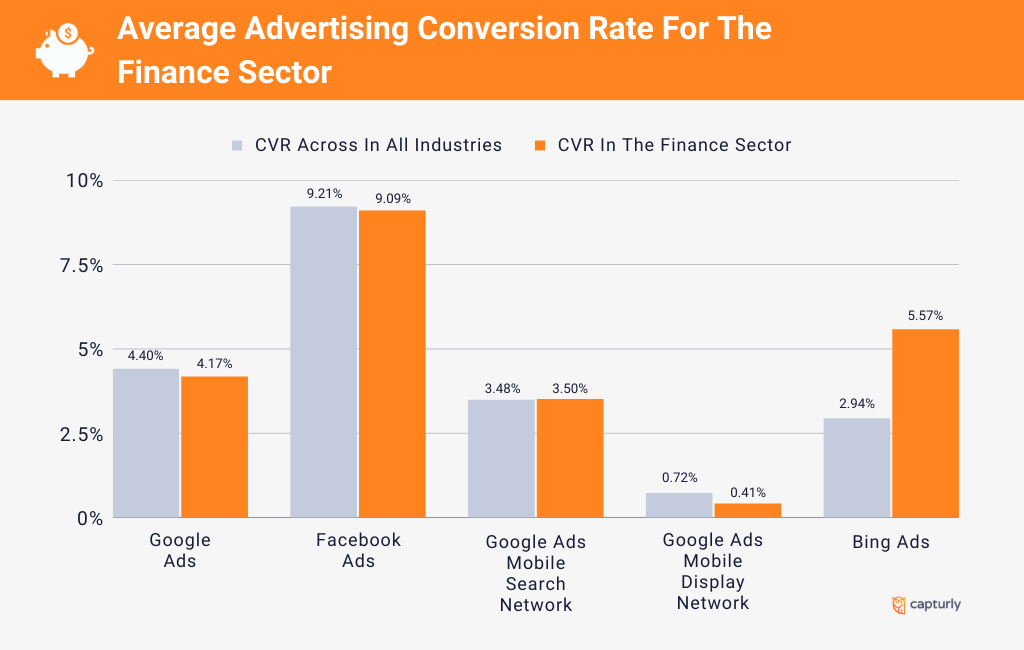
Average advertising conversion rate for the Finance Sector
Finding the average advertising conversion rate can be quite a challenge, especially in the financial sector. According to WordStream’s survey, Facebook Ads prove to be the most effective, boasting an impressive conversion rate of 9.09%. Another surprising finding is that Bing Ads outperformed the overall industry average conversion rate of 2.94%, standing at a noteworthy 5.57%. Not to be left behind, Google Ads also made it to the winners’ circle with a respectable average conversion rate of 4.17%.
Summary
In general, there isn’t just one definitive average conversion rate. It largely depends on the specific financial activity you’re engaged in, the target audience, the location, and the price point. Essentially, the average conversion rate can span from 2% to as high as 20%. However, in my opinion, aiming for an achievable target of 2% to 5% for the average conversion rate seems reasonable.

SaaS
Unlike in previous industries, the way we assess the average conversion rate for SaaS businesses follows a slightly different approach.
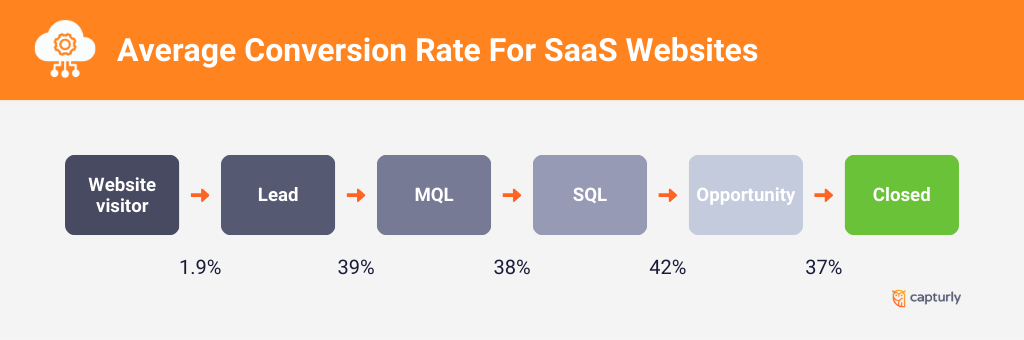
According to FirstPageSage, the most effective representation of the conversion rate for SaaS businesses is through the concept of a funnel. Before we delve into benchmark analysis and reach any conclusions, let’s take a moment to define some of the key terms we’ll be using:
- Website Visitor: This term speaks for itself – it refers to a user who has come to the website.
- Lead: A lead pertains to website visitors who have submitted their contact information.
- MQL (Marketing Qualified Lead): An MQL is a lead exhibiting interest in a product or service and aligning with one of the company’s customer personas.
- SQL (Sales Qualified Lead): An SQL is an MQL that shows a keen interest in the product or service, has engaged with a salesperson, and expresses intent to make a purchase.
- Opportunity: This refers to an SQL who has progressed to the stage of signing a contract with the SaaS provider.
- Closed: Signifying a completed transaction, ideally resulting in a contented customer.
Average conversion rate for SaaS Websites
For SaaS websites, about 1.8% of the visitors to the website will submit their contact information. Among these, around 39.0% will align with your customer personas, and approximately 38.0% will genuinely show interest in your product. However, a significant portion, around 42.0%, of these will proceed to sign a contract, and out of these, about 37.0% will ultimately complete the final purchase.
Continuing with this line of thinking, let’s delve into the average conversion rates within specific subcategories of the B2B SaaS websites.
Average conversion rate by subcategory for B2B SaaS Websites
The graph below displays the average conversion rates for various subcategories of B2B SaaS Websites, compiled by FirstPageSage.
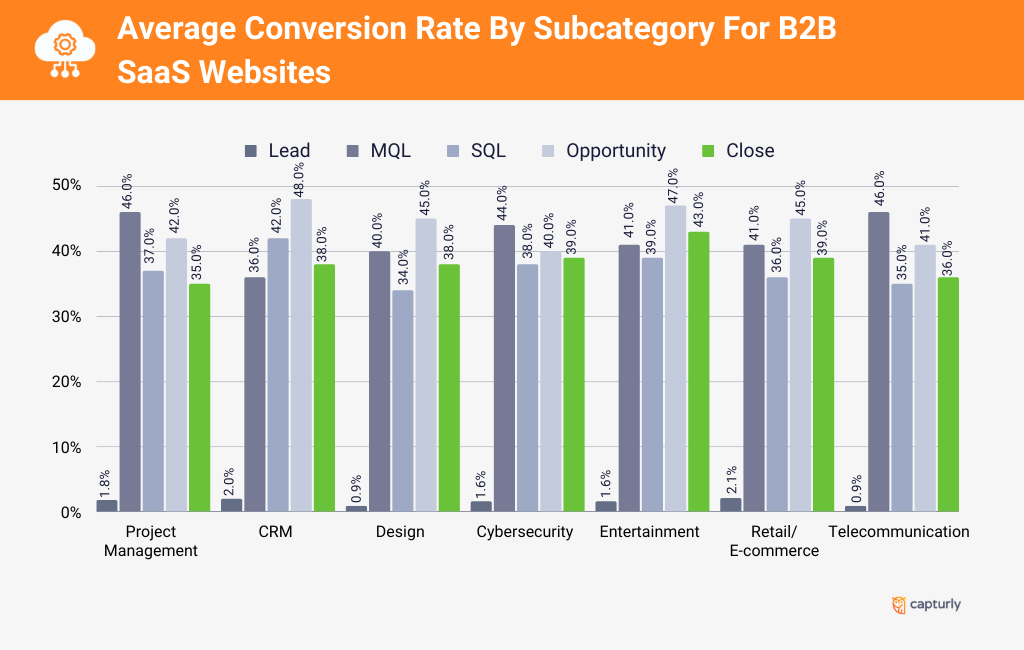
For example, in project management websites, 1.8% of visitors provide their contact details and become a lead. Of these 1.8%, 46.0% are users who could be potential customers, but only 37.0% are actually interested in your product. However, 42.0% of them sign a contract and 35.0% complete the process.
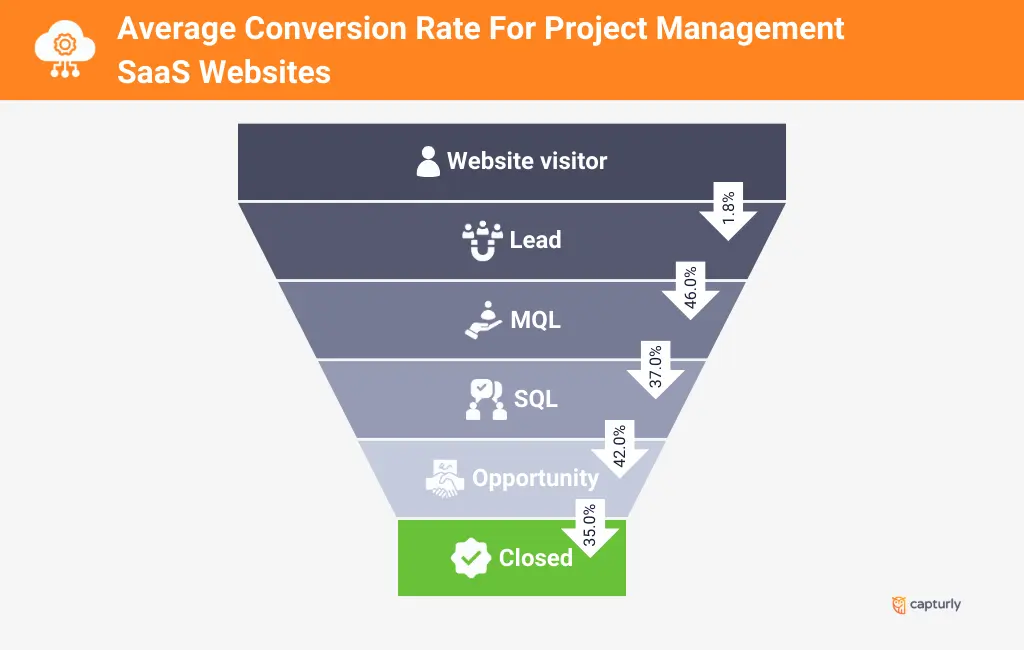
But what does it look like in real life? Suppose you have 10,000 visitors to your site. Of these 10,000 visitors, 180 users enter their data in some way. Of these, about 82 will become potential customers and 30 will actually be interested in your product. 12 will sign a contract and 4 users will complete the process.
Summary
As in any industry, the average conversion rate varies greatly depending on exactly what you do, who you sell to and where you sell. Basically, SaaS websites can have a high drop-off rate, but with a conversion funnel, you can easily track progress and optimize each step to increase the conversion rate.
How to improve your conversion rate?
Whatever industry you’re in and whatever your current conversion rate, it’s always important to review it from time to time, because you never know how much potential your business has. Here are few tips to improve your conversion rate:
✅ Follow up with your competitors
What is suggested to do overall is to follow up with your competitors. Try to find out what they do to increase their sales. If you take it seriously, you can even pretend to be a person who would like to buy from them.
When visiting their website, take a look at every little detail that might come in handy in the long run. Analyze the structure of the page and the hierarchy of each section. If you feel like every part of the website navigates you to take a serious step towards a conversion, then you should consider implementing their practices in your very own language! Don’t be a copycat, that’s in fact counterproductive.
✅ Understand your customers
And you know what’s more important than competitor analysis? Understanding the intentions and emotional background of your customers. Their welfare is the key source of your business success. So increasing customer engagement should be your number one goal.
Besides that, doing your market research is inevitable. Ask yourself who your ideal customer is and what they’re hoping to achieve when they reach out to you, then craft your communication so that it’s targeted directly toward them. Be aware of their desires and fears. Implement a branding strategy that helps get you closer to their hearts, so that later on they will choose you because of the bond you created with them earlier.
✅ Create engaging content
The key is to engage in two-sided communication with your customers. Don’t be afraid to ask them questions, but do it in a way that won’t make you look underqualified. The appearance of the internet made it so easy to find your target audience. However, in the midst of competition and the ocean of distractions, it’s extremely hard to keep one’s attention.
Furthermore, converting it to actual curiosity is even more difficult. But is the situation this ominous? Don’t think so. You just have to map out an evergreen strategy that is capable of following the permanent changes in customer demands. Yes, it does sound complicated, but believe me, it’s easily achievable as long as you run your business with consideration.
See, when it comes to boosting your conversion rate, it does need a lot of effort. In the meantime, however, if you only improve a tiny aspect of your business areas, you’ll likely receive exponential results.
But after all, you’re here for the optimal conversion rate for your industry, aren’t you? Well, after the stretched-out prologue, you no longer have to wait!
Conclusion
So the point is to analyze the attributes of your market and take a look at what the leading companies in your industry do on a regular basis. Also, you definitely need to create a two-directional communication channel to engage with your customers as well as possible.
You shouldn’t hit rock bottom after realizing what the average conversion rate is in your industry. Instead, concentrate on the development of your user experience, establish a well-operating branding strategy and try to unleash your inner creativity when you come up with new ideas.