Ever had the problem of not having enough views on your blogposts?
You manage every chain-link in the blog writing process perfectly but you are still unsatisfied with the results? You have particular problems but you have no idea about the reasons of these failures?
The keyword is analysis. This one is probably the last step in the cycle of creating your blog, when you check the results and make assumptions. Sometimes this mechanism can be pretty hard because you may not know where to start or what aspects you should keep an eye on while examining these causes.
About Capturly
Capturly can help you to discover those aspects and also professionally run the analysis processes. Other analytics software normally provides cold, quantitative information about the number of views, traffic, click rates, shares, likes, etc. However, Capturly will provide unique, particular and valuable qualitative data, based on user behavior like you’ve never seen before.
This will take your website analysis to a whole new level as its various interactive features are easy to use and extremely effective. They don’t just show the traffic rates like the number of visitors on your site, but also what they did and how they did those things. Having that information, you can figure out why they do them.
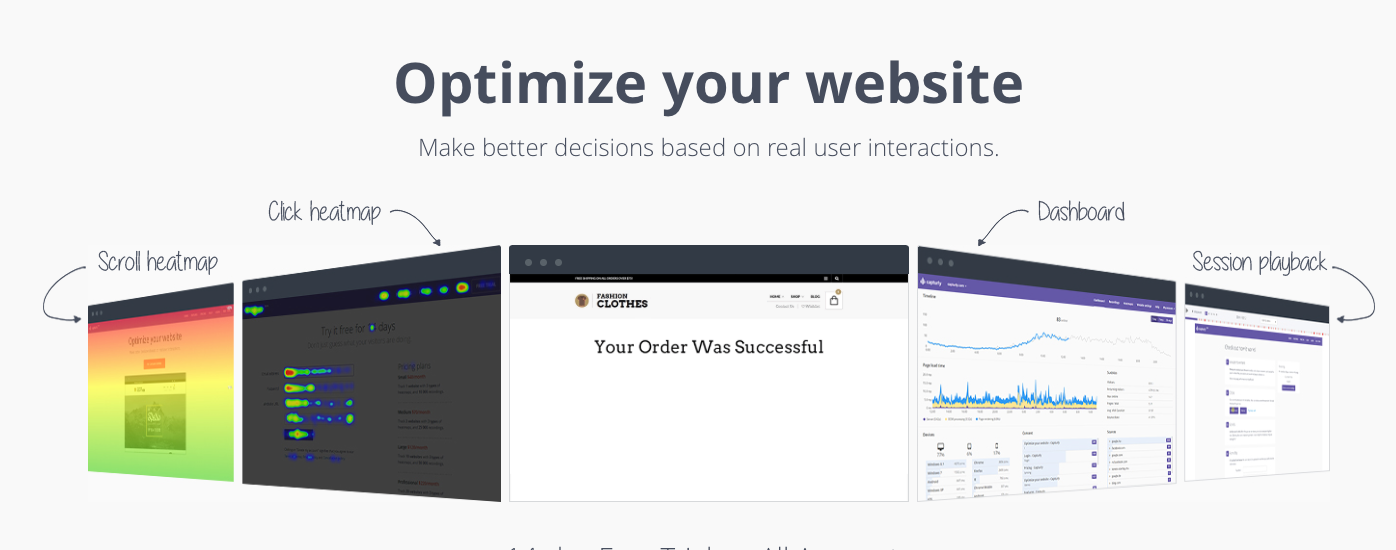
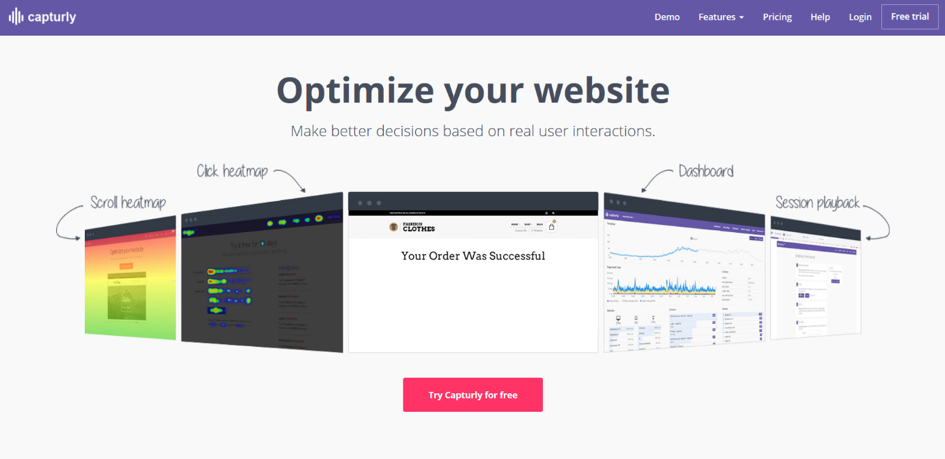
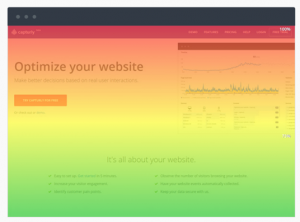
Optimize your website based on previously recorded, relevant and unique data.
Increase revenue and improve user experience.
Free trial
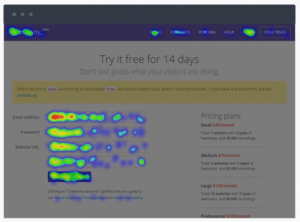
Our extraordinary services come with affordable pricing. There are 4 packages customized for various company sizes. Each and every package has its own numbers pieced together to fit the parameters for every enterprise.
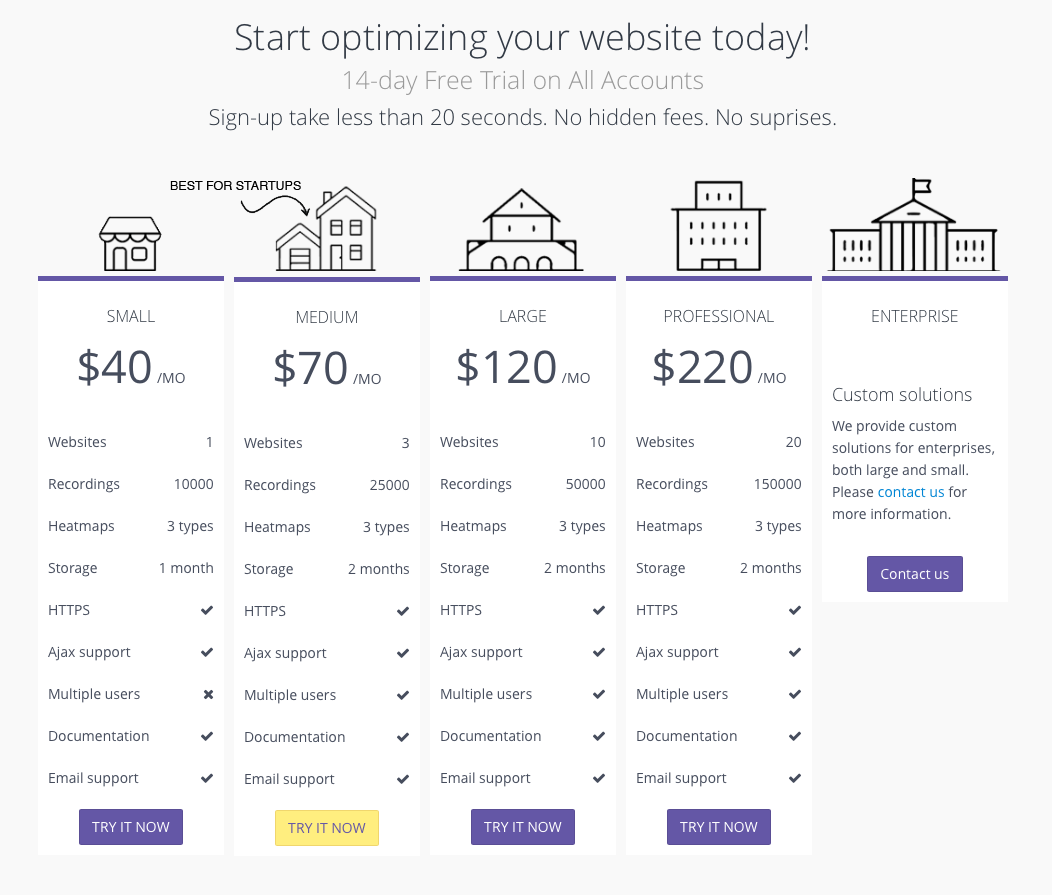
Choose the one that fits your business the most and try our free trial version for 14 days. We’ve launched this offer to allow people to examine that our services are useful and trustworthy without having to commit themselves. We are sure you won’t be disappointed and will shortly see enticing results in your website optimization using Capturly.
Hereafter I would like to guide you through the different features of Capturly to introduce what it’s all about. Follow me and immerse yourself in the exciting and appropriate tools of modern website analysis.
Dashboard
Ever imagined viewing all of the metrics you need to analyze your blog on one transparent and well-designed surface with comprehensive navigation? Capturly brings this to you with its exclusive feature: The Dashboard.
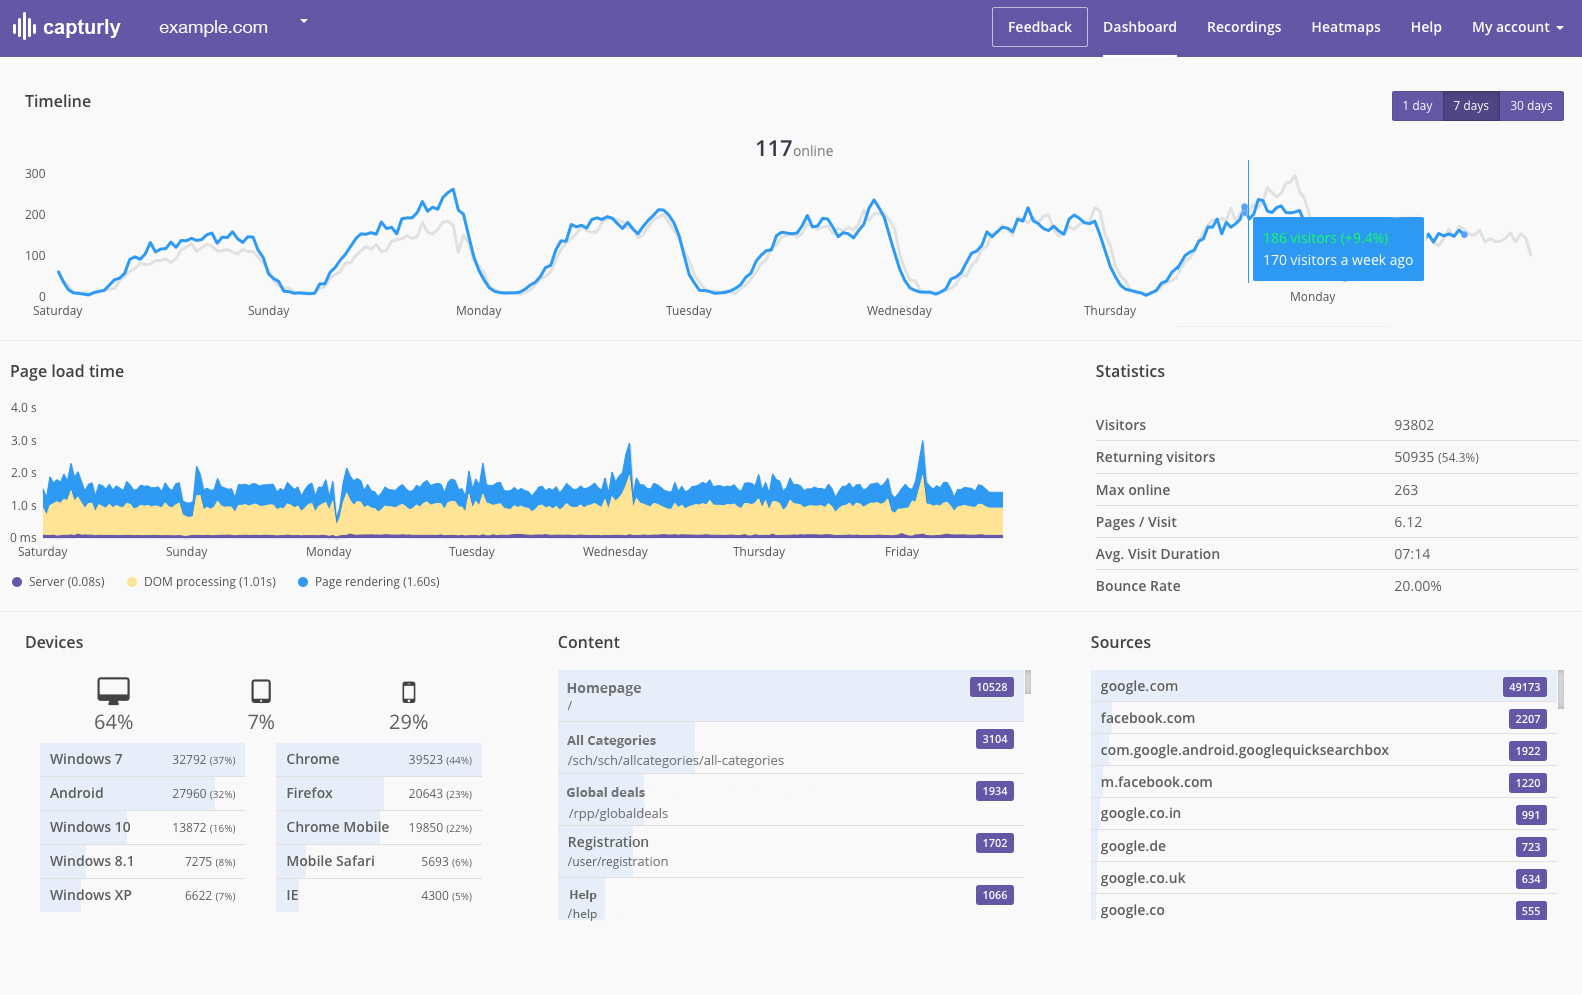
It displays data visualization in addition to all of the crucial metrics you need to observe your site effectively. Along with the many useful elements which will help you, I’d like to highlight two of them.
Regularly checking the page load time, you will be able to notice if your site is somehow slowing down immediately.
The other one, called the content dash lists the most interesting pages and parts of your site based on the views of your visitors.
Session recording
Probably this is the feature which really divides Capturly from most of the other analytic softwares. Actions speak louder than numbers. Despite other analytic tools which can only offer you exact statistical data, our Session Recording comes with something completely different.
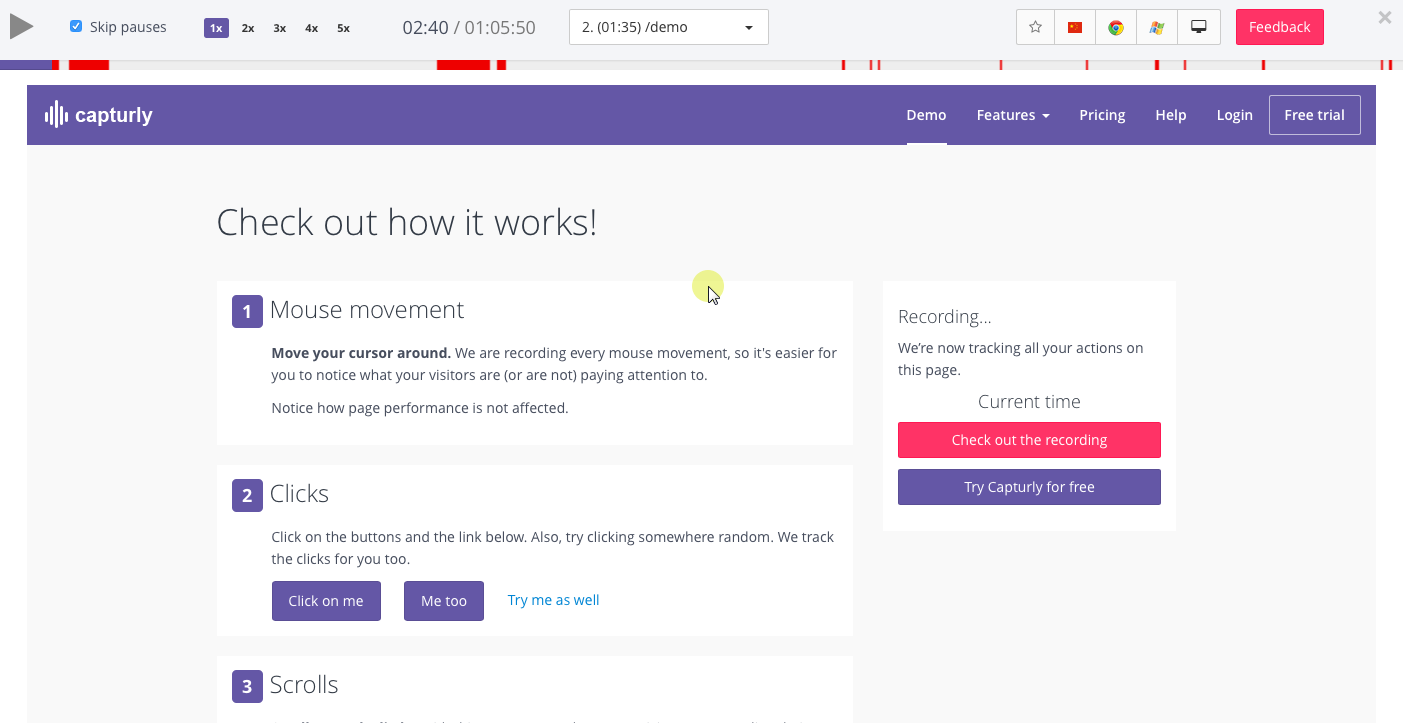
When creating every little part on your blog I bet you imagine visitors using and reading them the way you want them to. But let’s be honest, there’s almost no chance of this happening. What would you do if you could sit behind every people who visit your site? What assumptions would you make? What would you do differently if you had this type of insight?
With Capturly’s Session Replay tool, it is finally possible in a fast, convenient, and transparent way. Using this, you’ll be able to record every momentum each user takes on your site. Our tracking script captures everything from clicks to mouse movements. Find the most crucial pain points of your site, find out if a user hesitates to take a particular action, light up problems you would not even think about, and optimize your website based on real visual data of the behavior of your users.
This advanced system filters recordings according to your will and supports all kinds of screens and devices. The size of the tracking code is also pretty small and it loads in an asynchronous way, which is quite useful as it won’t slow down your system.
Heatmaps
A further visual tool (or let’s say tools) provides exciting, relevant, and useful data which is easy to clarify. Using colors, the heatmaps will show you the most and less crucial parts of your site, according to your users’ activity. This way you can focus on optimizing each part of your blog, especially the ones you want to drive your visitor’s attention to. Remember: no matter how complicated your page might look, our heatmap will always be accurate.
There are three particular types of heatmaps. Each has its own function to measure and present clear visual information according to the various aspects.
 Do visitors use your menu bar and other buttons properly, or are there a lot of so-called dead buttons on your blog? Find out with the Click Heatmap.
You have to be conscious of the fact that people click on particular buttons when they pay attention to or are interested in the content.
Think about it, where do you want to focus people’s attention? Does it happen the way you plan it? Click Heatmap will mark the busy parts of your site with warm colors so you can discover the most and the less used buttons.
Exploring user’s behavior this way you can easily find out which buttons need to be prioritized, modified, or even removed.
 Statistics have shown that 80% of the users only pay attention to 20% of your site, which is usually the “above the fold” section. However, only 20% of the visitors make it through the other 80% of the site. That is why you have to put effort into the first things catching people’s attention. But is this a truly strict fact? You can easily prove or disprove this statement in connection with your blog using the Scroll Heatmap.
This tool not only makes it simple to observe how far people will scroll down on your site but also shows the percentage of them leaving the page earlier than they are supposed to. Being informed about visitors’ scroll behavior will make it easier to decide where to place the action bars, pictures, or CTAs you think are important to be noticed. Try to test your target audience’s ideal sites and remember, every blog or page is different. Examine why and when they leave your site because of losing interest. In addition to all of these things, optimize your site by placing crucial elements that are most viewed 20% of your blog, and by removing things that are ignored by the users. Test the results of short and long-term changes with this unique way of the analysis process.
If you look at a Segment Heatmap you will see a bunch of colorful dots scattered in a messy way around particular parts of your site. By viewing the density of the dots you can identify the most popular sections of the site and compare each segment and make assumptions about how they interact with each other too.
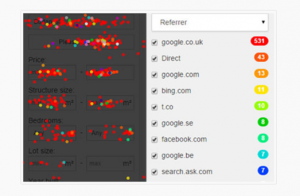
You can filter the dots to mark the referrers of your website. This way you can detect which referrers do your most active or most problematic visitors use. You can also identify the most commonly used browsers and operation systems too. This way you can optimize your site to each system based on the results of this heatmap.
Let me explain this through a particular example: If there is a commonly used button clicked by Firefox, Google Chrome, and Safari users, but you can’t see any clicks from visitors using Internet Explorer, maybe there’s a problem with the Explorer compatibility. The button might not be visible through that browser because of the different spacing.
If you know the problem you can conclude the reasons based on reliable data and you can easily develop functional solutions to optimize your website and gain positive results.
Installation
We hope that this short presentation about this new and constantly evolving analytic software was informative enough and caught your attention.
But for now, we are going to finish with a little user’s guide to show how you can actually install this plugin to start the most effective analysis process instantly.
First, you need to go to Plugins menu in WordPress, then simply type and search for Capturly or simply click here.
To install and activate the plugin unzip and upload Capturly directory to the /wp-content/plugins/ directory. (For this you are going to need WinRAR or other similar software installed on your computer).
Next, activate the plugin through the Plugins menu in WordPress and by going to the Settings/Capturly you can configure the plugin.
Do you have any thoughts or feedback? Discuss it with us.
If you liked the article, it would mean the world to me if you recommended or shared it.