![Average Order Value by Industry 2023 [Benchmark]](https://capturly.com/blog/wp-content/uploads/2023/12/Average-Order-Value-by-Industry-2023-Benchmark-1.png)
Today, let’s explore the interesting concept of “Average Order Value” (AOV) – a special number that acts like a secret code to understand why people purchase items. It’s like our guide on an adventure to uncover the secrets of consumer behavior and assist businesses in adjusting their strategies for the best results. So, get ready as we start this data-driven journey, discovering the wonders of AOV, how it’s figured out, and the special insights it gives us in various industries. Ready? Let’s roll!
Table of Contents
What is the Average Order Value?
Before we jump into the exciting stuff, let’s get a solid grip on what Average Order Value (AOV) is all about. Simply put, AOV is like the average spending superhero – it tells us how much, on average, a customer shells out in one shopping trip.
💡 Imagine your friend hits up a store and grabs a snazzy pair of sneakers for $80 and a slick backpack for $50. Now, here’s where AOV struts in: we add up those buys ($80 + $50), then divide it by the number of items bought (2). The result? The average order value for that shopping spree is $65.
In simpler terms, AOV is like finding out the magic number that represents what a customer typically spends when they decide to treat themselves. It’s like having a price tag on the average shopping bag, giving businesses a sneak peek into what makes customers open their wallets.
The Concept of Average Order Value
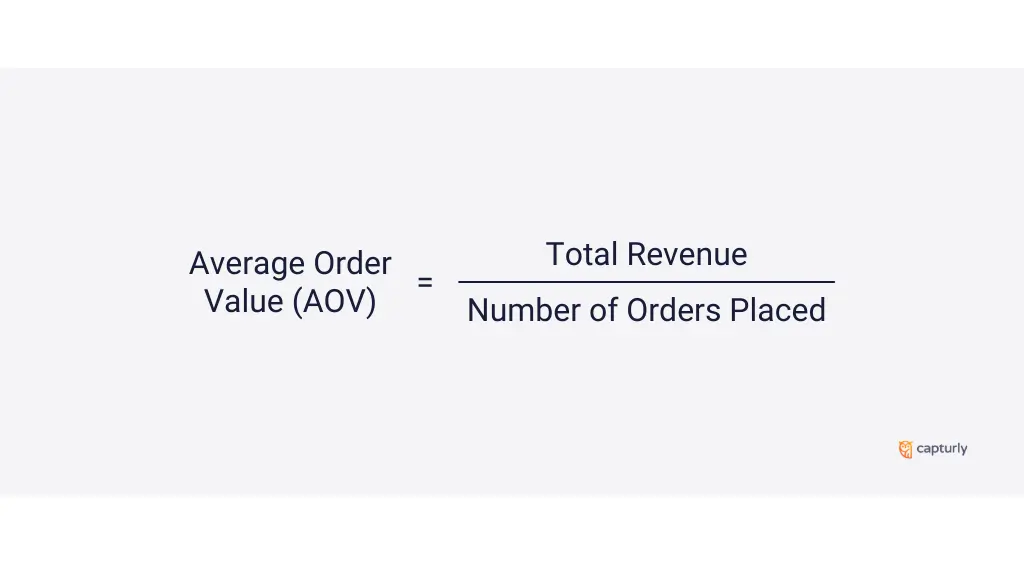
So, how do we figure out this AOV thing? It’s pretty simple math magic. Take all the money a store makes from selling their goodies and add it up. Next, divide that total by the number of times people bought something. That gives us the average amount a customer spends – that’s our AOV.
In other words, if a store made $500 from 10 sales, the average order value is $50 ($500 ÷ 10). It’s like finding the sweet spot where businesses can see the average spending habits of their customers.
Why is it Important to Monitor?
All right, you might be wondering, why is AOV such a big deal? Well, it’s not just a number for business wizards to crunch. Monitoring AOV is like having a trusty compass in the business world. It helps guide decisions and reveals patterns that can seriously impact how much money a business makes.
💡 Think of it this way: If average order value is like a compass, then tracking it is like knowing which way to go. Businesses can see what’s working and what’s not. It’s a tool that helps them understand if customers are spending more or less over time. Getting this kind of insight is like having a superpower – businesses can adjust their strategies and make choices that result in more success and money.
In a nutshell, AOV isn’t just a bunch of numbers; it’s a business compass pointing the way to smarter decisions and better profits. So, let’s keep our eyes on the average order value compass as we navigate the exciting world of consumer behavior!
What Can Affect Average Order Value?
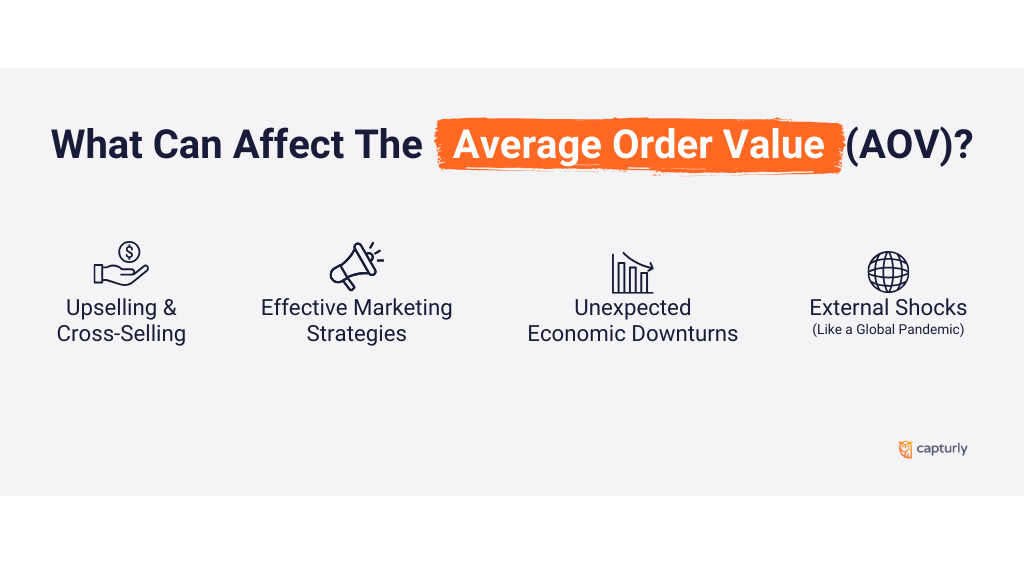
AOV isn’t set in stone; it’s like a flexible friend that responds to different moves. Here are some factors that can shake things up:
- Upselling and Cross-Selling: Ever been asked if you want fries with that? That’s upselling. Offering a complementary product (cross-selling) can make customers add more to their carts. Result? Higher AOV.
- Effective Marketing Strategies: A well-crafted marketing strategy can tempt customers to explore more and buy more. Discounts, promotions, or even catchy ads – they all play a part in boosting AOV.
- Unexpected Economic Downturns: When wallets tighten during tough economic times, customers might trim down their spending. This can lead to a dip in the average order value.
- External Shocks (Like a Global Pandemic): Unpredictable events, such as a pandemic, can throw a curveball at AOV. Customer behaviors might shift, impacting how much they’re willing to spend.
Knowing what affects AOV is crucial. It’s not just about watching numbers; it’s about adapting strategies. If upselling is doing wonders, businesses can enhance those efforts. If there’s an economic storm brewing, they can prepare for a potential dip in AOV and adjust their sails accordingly. Monitoring average order value is like having a radar for the unexpected. It helps your business navigate the ups and downs, making informed choices that keep them on the path to success.
Average Order Value By Industries [Benchmark]
These figures provide valuable insights into the spending patterns across diverse industries.
In certain areas, things stay pretty stable, but in others, they go up and down because of stuff like seasons, market trends, and how people buy things. For businesses to do well in the ever-changing world of online shopping, it’s crucial to get what makes each area different.
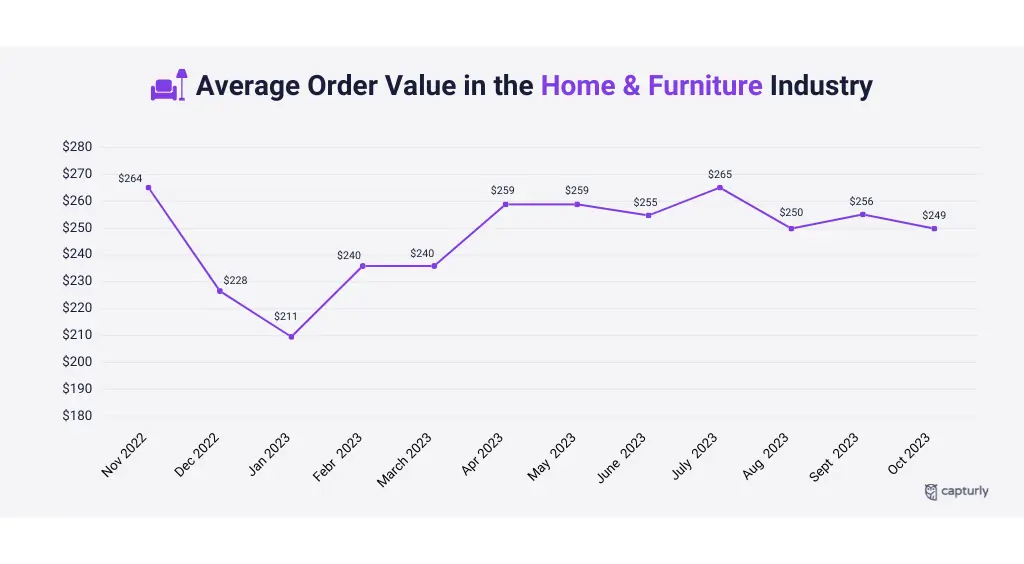
Home and Furniture
Jump on the exciting ride through the world of home and furniture trends! By Marketplash we’re checking out how much people spend each month, and it’s a bit like a rollercoaster of shopping adventures.
- November 2022: The home and furniture party started with a bang – people were spending around $264. It’s like they were gearing up for cozy winter vibes.
- December 2022: Things cooled down a bit in December, and the spending dropped to $228. Maybe folks were saving up for holiday gifts.
- January 2023: New year, new vibe! Spending settled at $211. It’s like a post-holiday breather – wallets needed a break.
- February and March 2023: Cue the comeback music! February and March saw a rise, hitting $236 and $240. It’s like the industry got a makeover and shouted, “Check out our cool stuff!”
- April and May 2023: Spring came, and so did the spending enthusiasm – $259 in April and May. Seems like everyone wanted to give their homes a fresh look.
- June 2023: June added a bit of suspense with a tiny drop to $255. A plot twist, maybe? We’re curious about what’s happening behind the scenes.
- July 2023: Hold your excitement – July brought back the joy with $265. It’s like the industry threw a summer bash, and shoppers couldn’t resist the fun.
- August 2023: Plot twist time! August shook things up with a drop to $250. Like a twist in a movie, shoppers were changing their spending plans.
- September 2023: September felt like a cozy comeback with $256. It’s like the autumn breeze brought back the shopping spirit.
- October 2023: October joined the story with a subtle drop to $249. Setting the stage for the upcoming holiday buzz, maybe?
Source: Dynamic Yield
Summary
In this cool story, the home and furniture industry dances with the seasons. Sometimes people go all out, and other times they take it easy. The magic spending number seems to be around $250, capturing the vibe of home happiness all year round.
Fashion, Accessories, and Apparel
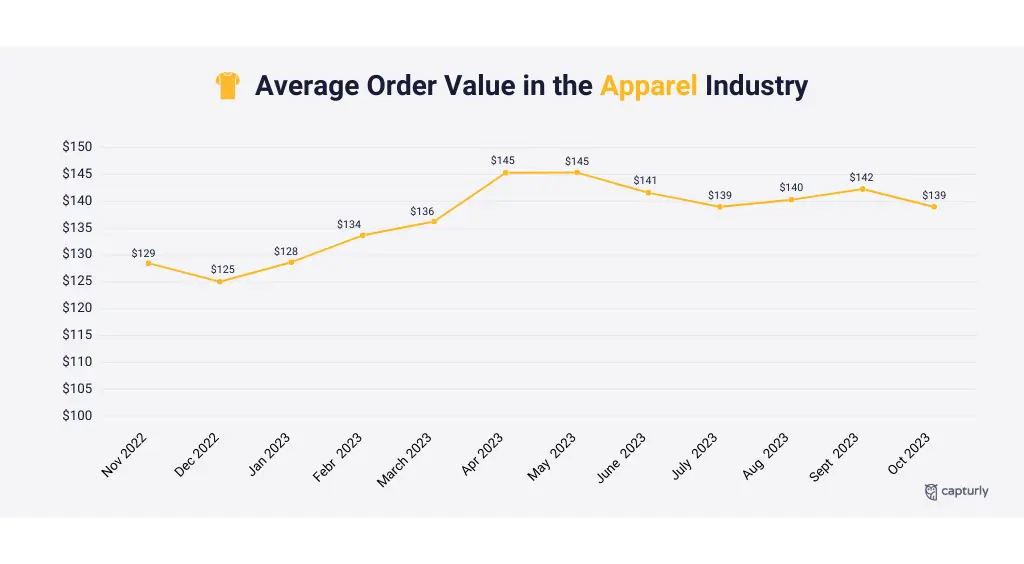
Exploring the fashion, accessories, and apparel industry through data, let’s break down the average order values month by month:
- November 2022: The winter season started strong with an average order value of $129, showing high demand for seasonal wardrobe updates.
- December 2022: Despite the festive season, the value dipped to $125, suggesting people might have spent more on holiday promotions and gifts.
- January 2023: The new year saw a small rise to $128, as consumers refreshed their wardrobes after the holidays.
- February and March 2023: The industry picked up, reaching $134 and $136, responding to new fashion releases and growing consumer interest.
- April and May 2023: Spring brought a spending surge, peaking at $145, following the trend of updating wardrobes.
- June 2023: Despite a slight dip to $141, the industry held strong, influenced by changing consumer preferences or mid-year sales.
- July 2023: Mid-summer spending remained robust at $139, showing continued consumer interest in fashion during warmer months.
- August 2023: Stability persisted with an average order value of $140, suggesting sustained consumer engagement in summer fashion.
- September 2023: September climbed strategically to $142, aligning with fall collections and seasonal trends.
- October 2023: A modest dip to $139 in October might reflect consumer anticipation for upcoming holiday collections.
Source: Dynamic Yield
Summary
Conclusions from this analysis reveal a dynamic industry responsive to seasons and consumer preferences. Peaks in order values coincide with key events like seasonal releases. The target range for the industry’s magic spending number seems to center around $140, affirming consistent consumer investment in fashion. This data-driven narrative sheds light on the ebb and flow of fashion commerce, offering insights for industry stakeholders navigating consumer trends.
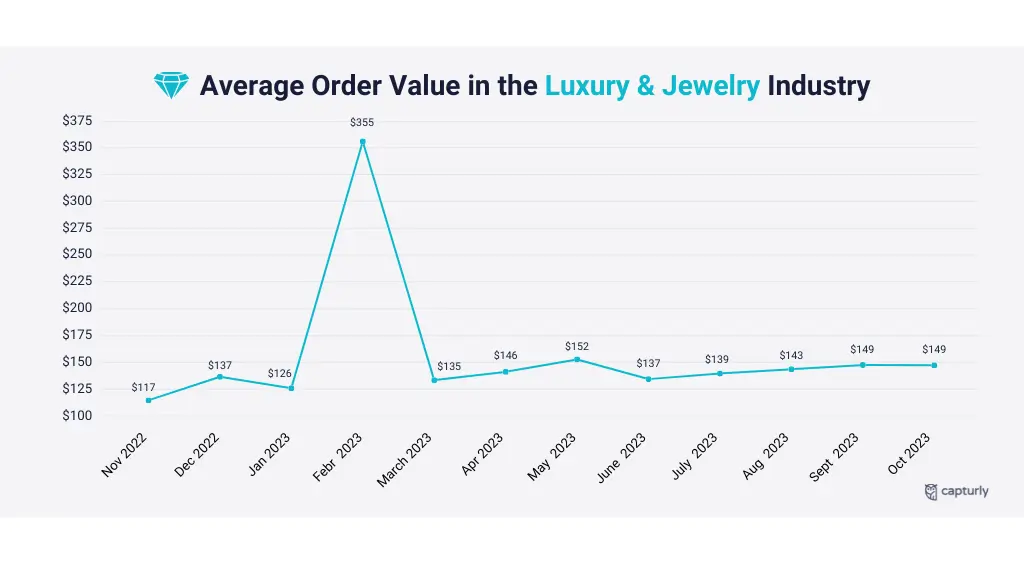
Luxury & Jewelry
Starting a fancy journey into the world of luxury and jewelry, our exploration of monthly average order values reveals a story of elegance and how people buy things.
Monetate data shows that, in August and September 2023, people spend the most on electronics and luxury goods. So, the average order value for these industries is the highest every other year.
- November 2022: The luxury season began with an average order value of $117, setting the stage for a stylish holiday season.
- December 2022: The sparkle intensified in December, with the average order value soaring to $137. Holiday festivities likely played a pivotal role in this surge.
- January 2023: The new year witnessed a slight dip to $126, reflecting a potential cooldown in luxury purchases after the holidays.
- February 2023: A significant leap to $355 in February indicates a spike, often attributed to the influence of Valentine’s Day, where lavish gifts and jewelry purchases surge.
- March 2023: After Valentine’s peak, spending settled at $135, showcasing a return to normal patterns post the holiday fervor.
- April and May 2023: The allure of luxury persisted, reaching $146 and $152. As spring unfolded, consumers indulged in opulent purchases, possibly driven by seasonal events or celebrations.
- June 2023: A gentle dip to $137 in June may suggest a natural fluctuation as consumer spending patterns adjust.
- July 2023: The summer continued to shimmer with an average order value of $139, highlighting sustained interest in luxury items during warmer months.
- August 2023: August witnessed a gradual rise to $143, signaling a potential alignment with summer events and promotions.
- September 2023: A further ascent to $149 in September suggests growing enthusiasm for luxury purchases, potentially driven by new releases or seasonal trends.
- October 2023: October maintained a luxurious status with an average order value of $149, reflecting sustained interest in opulent acquisitions.
Source: Dynamic Yield
💡 Valentine’s Day Influence: Notably, the substantial surge in February to $355 is indicative of the impact of Valentine’s Day. During this romantic season, the demand for luxury gifts and jewelry often experiences a remarkable uptick as individuals seek to express affection through lavish gestures.
Summary
In conclusion, the luxury and jewelry industry follows the rhythm of seasonal events and celebrations. Peaks in average order values align with moments of heightened emotion and gifting occasions, offering a glimpse into the intricate relationship between luxury commerce and consumer sentiments. As we traverse the world of opulence, the target range for the magic spending number appears to orbit around the mid-$140s, reflecting a consistent appetite for exquisite indulgences throughout the year.
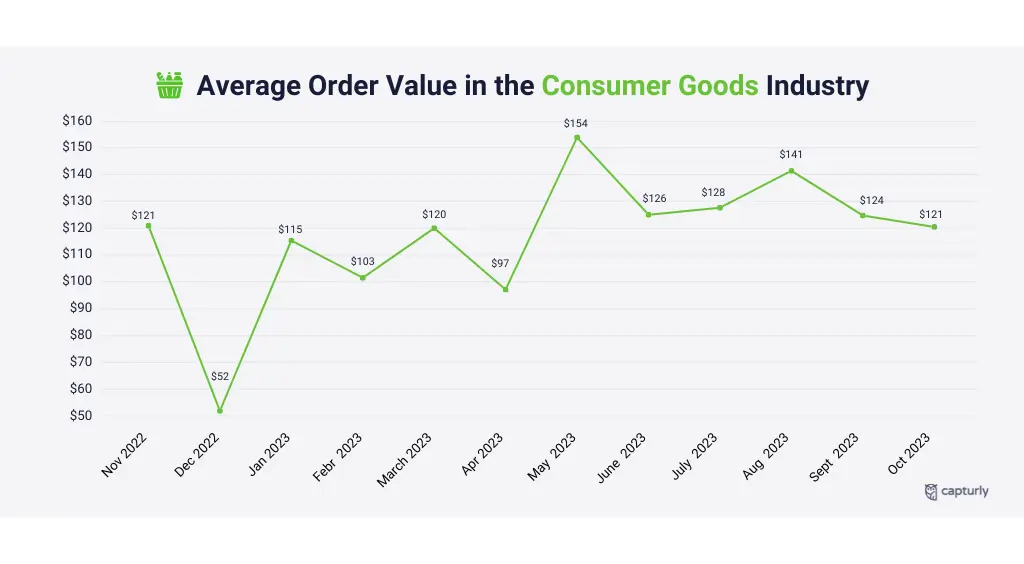
Consumer goods
Starting a thorough investigation into consumer goods, our close look at monthly average order values exposes interesting patterns within this lively sector by Dynamic Yield:
- November 2022: The consumer goods show began with an average order value of $121, setting a baseline for the upcoming shopping months.
- December 2022: A significant drop to $52 in December suggests a noteworthy departure from the usual. This unusual change can be linked to the holiday season, where consumers generally concentrate on buying many things at lower prices.
- January 2023: The new year ushered in a partial recovery, with the average order value rising to $115. Consumers may have adjusted their spending habits post the holiday extravagance.
- February and March 2023: A modest fluctuation ensued, reaching $103 and $120, respectively. Potential factors may include strategic promotions or seasonal adjustments in consumer preferences.
- April 2023: A dip to $97 in April suggests a potential lull in consumer goods purchases. External factors like economic shifts or market dynamics could contribute to this trend.
- May 2023: A sharp rise to $154 in May signals a resurgence in consumer interest. Seasonal events or strategic marketing efforts may have played a role in this uptick.
- June 2023: Consumer goods maintained momentum with an average order value of $126. This steady performance aligns with an industry finding its stride after potential fluctuations in the preceding months
- July 2023: July mirrored the stability, maintaining an average order value of $128. Consumer confidence and targeted promotions could be contributing factors.
- August 2023: An incremental increase to $141 in August suggests a positive trajectory, potentially fueled by mid-year sales or seasonal demand.
- September 2023: A moderate dip to $124 in September might reflect a natural ebb in consumer spending patterns. This could be influenced by factors such as back-to-school priorities or economic considerations.
- October 2023: October kept a steady average order value of $121, showing a stabilized condition in the sector.
Source: Dynamic Yield
💡 Noteworthy Point: Consumer goods secured its place as the fourth-ranking sector, proudly presenting an average order value of $126 and joining the special group of sectors exceeding the $100 mark in June 2023.
Summary
In summary, the consumer goods sector demonstrates resilience affected by dynamic market forces. High and low points in average order values may be linked to changes in seasons, economic factors, or planned industry events. The magic spending number for this sector sits around the mid-$120s, showing a balance between what consumers want and how the industry operates.
Average Order Value in 2023
Now let’s look at the average order value in 2023 within the 4 industries examined above.
The highest order value is in the Home and furniture industry, with an average order value of $248. In second place is Luxury & Jewelry, with a much lower average order value in this industry compared to the previous one, but still a nice performance: $163. The third industry on the list we examined is Fashion, Accessories, and Apparel, with an average order value of $139. The fourth category is Consumer Goods, where the average order value in 2023 was $123.
Average Order Value In E-commerce (2017-2023)
It is interesting to recall how the average order value in e-commerce has changed since 2017 to today. During this period, there have been several changes, particularly the pandemic, which has radically changed the way people shop and the volume of purchases they make. First, during the pandemic, consumers tended to focus their shopping on essentials. But as the world slowly emerges from the pandemic, shopping habits are changing again.
According to the latest e-commerce data from Statista in July 2023, the average order value for e-commerce was around $122.82. This marks a 9.75% increase from the average order value in 2022, but it’s a bit slower than the previous year’s growth of 10.14%. So, even though the average order value has been going up over the years, the rate of increase has slowed recently.
The most significant drop in the average order value occurred in 2020, with a decrease of 13.08%. This was mainly because of the impact of the coronavirus epidemic, which led to a decline in consumer confidence, and people spent more cautiously in anticipation of tougher times.
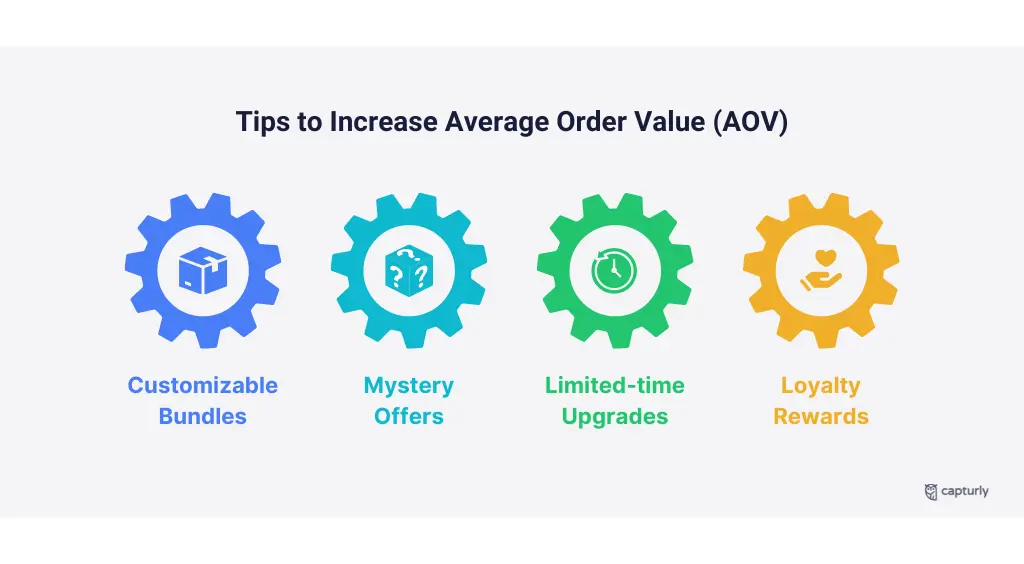
Tips to Increase Average Order Value
Unlocking the full potential of your business often involves strategic moves to boost the Average Order Value (AOV). In this guide, we’ll explore actionable tips that go beyond the usual playbook, offering innovative and effective ways to elevate your AOV game. From interactive bundles to mystery offers, discover unique strategies to not only meet but exceed your target numbers and enhance your bottom line.
1. Create Customizable Bundles
Tailor the experience and let customers be the architects of their deals. By offering customizable bundles, you tap into their preferences, making the shopping experience feel uniquely theirs. Personalization is the key!
2. Delve into the Thrill of Mystery Offers
Enhance the shopping adventure by linking enticing offers to specific spending thresholds. Imagine this scenario: as customers hit a designated spending level, unlock surprise rewards—an unexpected bonus that not only sparks excitement but also motivates them to dive deeper into your products, unveiling access to exclusive deals.
3. Harness the Power of Limited-time Upgrades
Infuse urgency into the checkout experience by presenting time-sensitive upgrades. Here’s how it works: as customers approach the checkout, offer them exclusive, time-limited upgrades, compelling them to seize the opportunity before these special deals vanish. It serves as a persuasive nudge for them to indulge and make the most of the moment.
4. Recognize Higher Spending Tiers in Loyalty Rewards
Imagine loyalty programs that extend beyond the ordinary. Picture this: instead of merely rewarding repeat business, design programs that acknowledge and celebrate customers reaching higher spending tiers. This strategic approach not only deepens engagement but also instills a sense of value, increasing the likelihood of them returning for more.
Conclusion
To sum up, AOV is more than just a number; it’s like a compass that helps businesses navigate the constantly shifting landscape of what customers like. By figuring out the special AOV patterns in your industry and trying out these clever strategies, businesses can not only hit their goals but go beyond them.
As we go through this journey, remember that average order value isn’t just about numbers on a screen; it shows the changing connection between businesses and their customers. So, let’s keep discovering, adjusting, and coming up with fresh ways to make shopping better and, as a result, increase that Average Order Value!