
Everyone who owns or manages an online business has to deal with analytics at some level. Nowadays, analytics is often time-consuming. However, it can offer endless possibilities as we can draw conclusions from sharing social networking content and getting feedback on it. We have far more tools for analysis than we think.
Table of Contents
Understand the needs of your customers
The data used in web analytics can be used in many ways. Virtually, only creativity can be the limit. However, the goal of this article is to show some practical examples of the variety of data uses.
Web analytics can help you map out the needs of your target market that you would ignore otherwise. By combining search terms and traffic data, many of the needs related to the website’s goals can be recognized.

Let’s say a website receives a relatively large number of visitors from Google. Many things can be inferred from the behavior of incoming visitors. For example, if many visitors come to your page for a particular keyword, but spend relatively little time on your landing page and typically move on the same path, it is a good indicator that they are not getting the expected content/value.
Formal conversion pages such as landing pages don’t work the same way in different areas. Therefore, it’s not only a good idea but it is a must to optimize them. Landing pages, in fact, are the best use cases for heatmapping software.
Website analytics tools that do the job
The best known and most popular web analytics tool, without doubt, is Google Analytics. In practice, Analytics collects a wide variety of data about a webpage and its visitors using codes embedded in a webpage. However, Google Analytics is not the only solution for this type of analysis, but it is by far one of the most useful. There’s a reason why I mentioned “this type of analysis” because GA is perfect when we need quantifiable data. However, it can’t describe the behavior of an individual user.
A proven method for website visitor tracking and user behavior is heatmap analysis, which gives feedback on which parts of the website are popular with visitors.
This also gives us visual feedback on which part of the webpage is getting the most clicks or how long the content should be. There are more sophisticated forms of heatmapping analysis, for example, when heatmaps are made based on eye movement. However, these are out of the scope of this article as they usually require expensive equipment and not just a single tracking code snippet.
Most popular website performance indicators (aka. what to measure)
- Conversion (Goal Completion): One of the most important metrics that can be linked to a business / corporate goal. For example, a form to fill in, a sign-up, a list subscription, a completed purchase, or even a video.
- Bounce Rate: As fun it sounds, this metric is probably the most fearsome of them all. The bounce rate is the percentage of single-page sessions. In this case, the user leaves the site from the landing page without further interaction. Ouch.
- Pages / Session: How many pages are viewed on average per session
- Average Session Length or Duration: The amount of time a user spends on a website per session on average
I could go much deeper into these metrics, in fact, these are just a few of the many. However, that’s a topic of another discussion. If you wish to read more about the website metrics mentioned above, feel free to read our article on Top 4 Website Analytics Metrics You Can’t Ignore.
These are the main indicators, important for every online business to track, but are they enough to really understand our visitors without getting lost in numbers? We show you an effortless way for the latter purpose.
Capturly’s website analytics feature:
Every website may come up with ideas and fixes that – while sounding good – may not work well when applied.
If you want to get an accurate picture of how your site is being used from the users’ perspective, Capturly is the tool that can show it to you. You have to think of it as many useful tools, packaged in a single platform.
Capturly has the following features:
- Quantitative Analytics
- Heatmaps
- Session recordings
- Funnels
While there are excellent analytics tools in use for a website, if the collected data can’t be transferred, it is harder to see the correlations. With Capturly, you can use all of the tools above with a single account. Let’s see how these can be used:
Website heatmaps:
Heatmaps allow you to clearly identify which parts are striking and help to determine where to position vital Call-To-Action elements such as
- buttons for subscribing to newsletters, or subscribing to trial plans
- anchor texts for additional information or contact
- search bars
- product or PR videos
and the list goes on and on.
In other words, it highlights you:
– the points on your web page that users click on most often
– areas where most mouse movements occur
– the part of the page that your visitors scroll down to
You have the option to track all your pages, or you can track only one specific page. It’s up to you.
For example, if you want to know whether your users are interacting more with a product image or with a description – without a special developer effort – you can decide it based on a heatmap.
Heatmaps will instantly give you ideas on where to focus. Checking one or two heatmaps in a month can already be a huge step forward in understanding your customers. If, let’s say, most of the visitors are interested in a photo of your product, you may want to upload more and higher quality images to boost conversion rates.
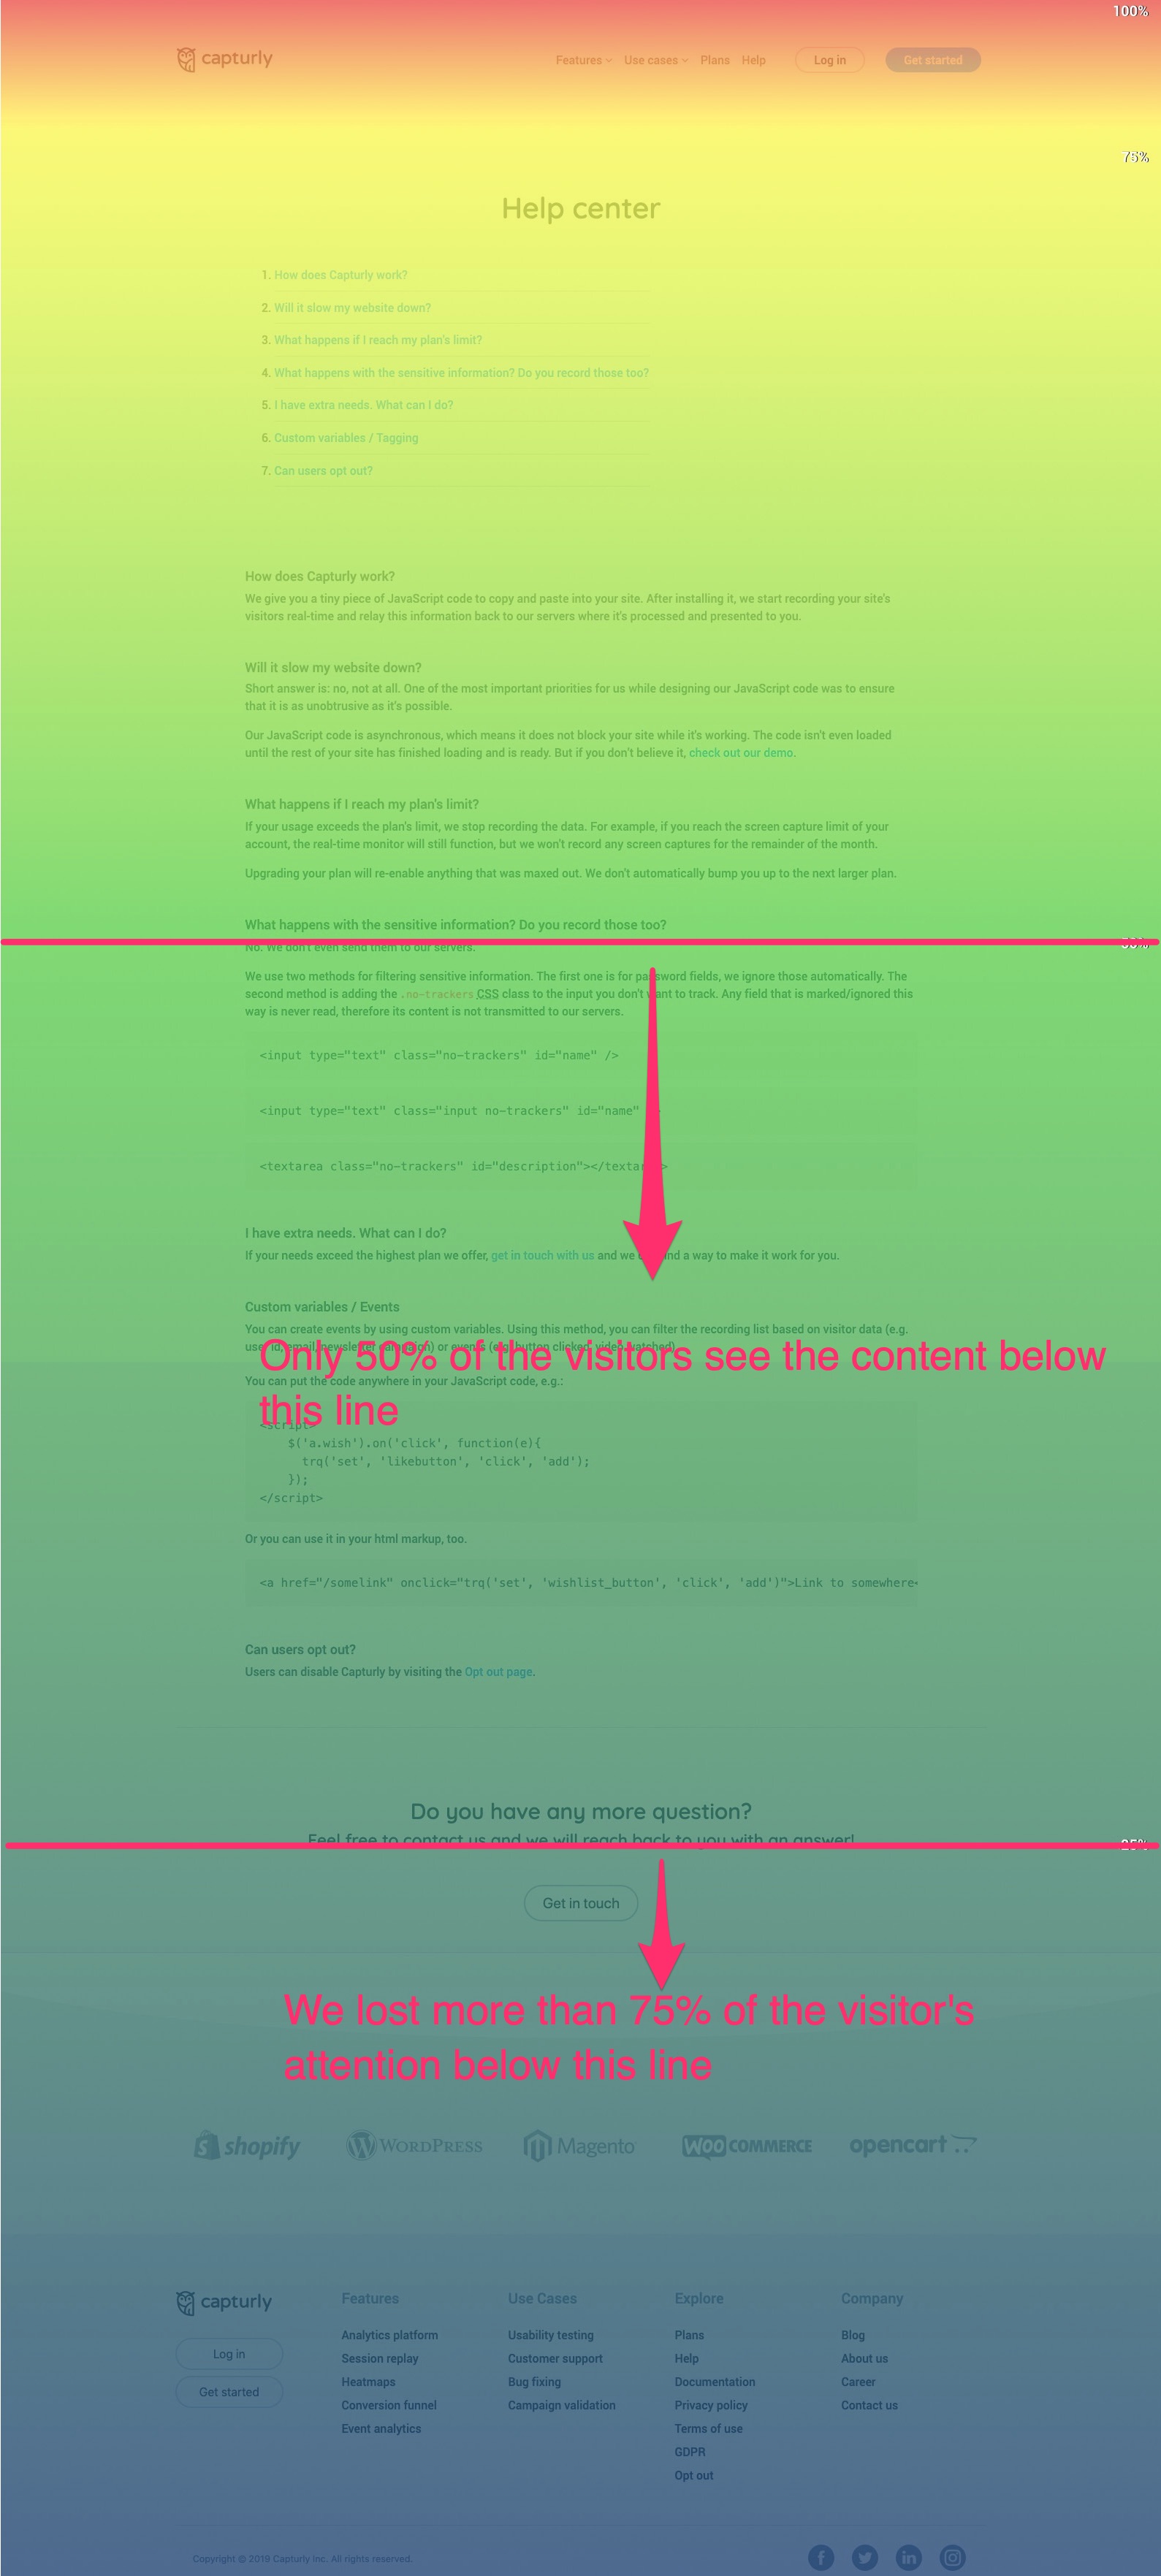
Another use case for heatmaps would be in case you are wondering how long a post or a product description should be. You can look at the scroll heatmaps of existing content to see how far the users scroll on average. If most visitors scroll down to the end of your post, feel free to write longer, more detailed content.
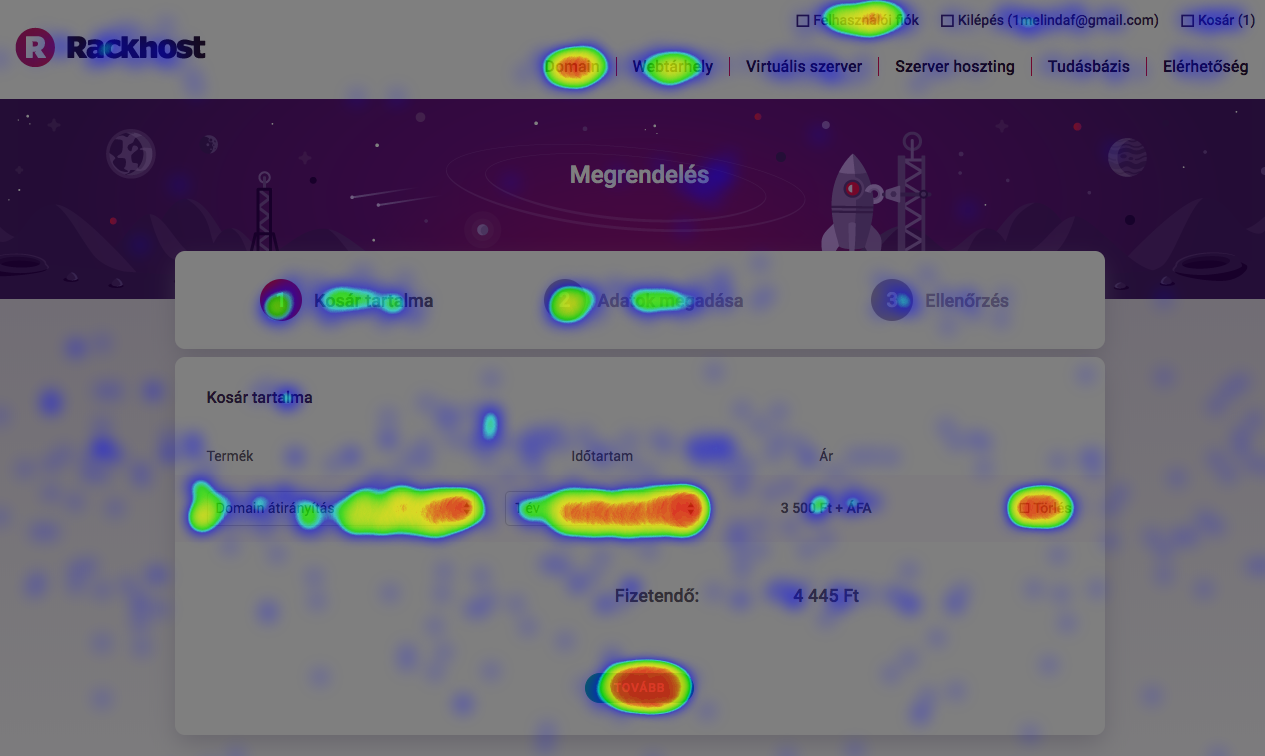
Session replays
While heatmaps allow you to measure the behavior of your visitors at once, you have the opportunity to analyze the behavior of each visitor individually thanks to session replays. Recordings offer you a fast and effective way to spot even the slightest differences in user behavior.
This gives you an interface similar to a video player where you can look at someone and be able to tell:
- where he moves the mouse cursor
- how he scrolls (often inconsistent, rapid scrolling is the indicator of someone searching but not able to find what he’s looking for)
- exactly where and how much he clicks
One of my favorite use cases for this is to filter out the visitors who made a purchase on the website I’m looking at from all the recordings. Then I look at about 20-30 session replays one by one and see if any pattern can be identified in their behavior. Then, I do the same for those who didn’t make a purchase.
This way I can see if there is a typical spot on the website that is causing the visitor not to convert.
If, for example, your visitors regularly close the page after a pop-up/sign-up box is shown to them instead of making a purchase, you may want to try a built-in form that gives the visitor more space to search for information, thus directing them more toward the purchase.
Conversion Funnels
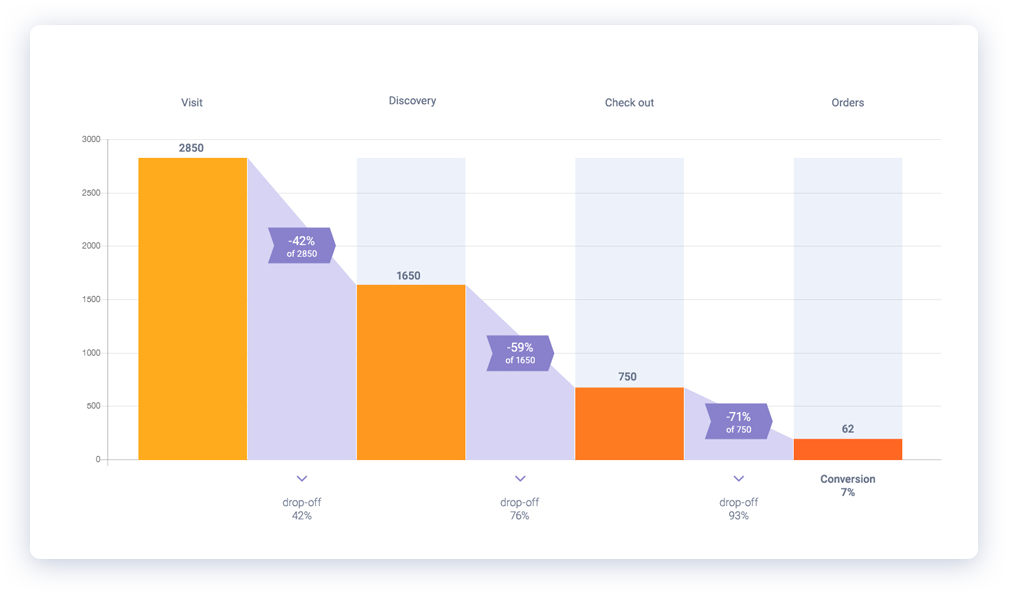
If you want to see exactly where you are losing most visitors in the buying process, a fine-tuned conversion funnel gets the job done for you.
Although you have the ability to set up similar conversion (or sales) funnels within Google Analytics, Capturly allows you to view the most relevant data for your company within a single interface. The best way to build a funnel is to start backwards from the conversion. If your goal is to measure purchases, then the last step is to make a successful payment. This is preceded by the payment details.
Before that, a product should be placed in the basket and so on. Optional steps should be avoided here to maintain an accurate measurement. What you need to define, are the main events that you are sure about. These are checkpoints that the users need to go through before they make a purchase.
Since I’m a fan of practical examples, let’s have the following scenario where the visitor:
Step 1. arrives to the landing page Step 2. inspects the product page Step 3. puts the product into the shopping cart Step 4. proceeds to the checkout page and makes the purchase Step 5. is greeted by a confirmation message on a dedicated pageOn the interface you can see at which step a certain percentage of visitors is “hooked”. I have come across a case where the shopping process in a webshop was nicely built, but all the mobile enthusiasts at the shopping cart got stuck. On closer inspection, it turned out that somehow the “next” button that led to the payment was omitted.
Of course, the example above is rare, but if you find that you are losing a lot of visitors because of a trivial, yet super important feature it will make you slam your head into the wall. To prevent such events from occurring, it might be a wise decision to watch a few session recordings to see why your “almost-made-it” visitors have bounced off.
Wrapping up
Understanding your main source of traffic is as important as it gets if you wish to maintain successful marketing. However, being able to react to actual user behavior, finding relevant pain-points before you start losing potential customers is a huge advantage.
Author: Eleonóra Kopilovic