Do you already have a website? Amazing! But the work starts just now! It’s not enough to create a site, you have to be able to measure its performance somehow, so you know what really works for your page and what doesn’t!
Don’t worry, everyone feels lost in the world of metrics at first, but with a little practice you’ll soon get the hang of it and your website traffic will skyrocket. And we can definitely help you get started!
Table of Contents
Why is it important to evaluate website data?
These are just numbers and unnecessary work, more things to worry about, maybe that’s what’s going on in your head!
But think about it, without numbers and metrics, how can you define how well your site is performing and where you stand in the competition compared to other sites in your industry?
Also, keep in mind that numbers and metrics can help you improve your webpage and make it more relevant to your visitors’ needs. This will ultimately lead to higher conversion rates and more revenue for you.
Where should I start evaluating website data?
I hope I’ve convinced you of the importance of evaluating website metrics in the foregoing and you’re now only wondering about where to start!
If yes, as a starting point, I advise you to get data and metrics straight in your head! Find out which metrics are useful and how they can help you develop your webpage. Let’s see some!
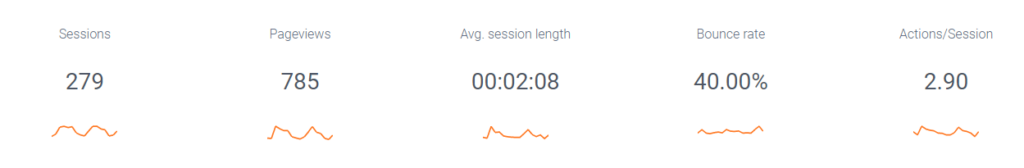
Page views
Pageviews refer to the number of times a webpage has been viewed or loaded by a user. With this metric, you can easily and simply measure the popularity and traffic of your website. If this value is low, it can have many reasons, you may not have used an attention-grabbing title for a site and people just don’t want to click on it.
Bounce rate
Bounce rate measures the percentage of visitors who enter a website and then leave without visiting any other pages on that site. If the content on your webpage is relevant and useful for your visitors or no issue appears on the site they will spend more time on it and your bounce rate will be lower. If your site has a high bounce rate – which can have many reasons – Google will rate it as a lower-quality page, which is definitely not a positive thing!
Sessions, average session length
A session refers to the period of time that a user interacts with a website. Average session length is the average amount of time that users spend on a webpage during a session. It can provide you insight into how engaging and valuable the content on a website is for users.
A longer average session length may suggest that users are finding the content interesting and are spending more time engaging with it. Conversely, a shorter average session length may suggest that users are not finding the content valuable and are leaving the webpage quickly.
Action/sessions
Action per session refers to the average number of actions taken by users during a single session on a website. Actions can include any type of engagement, such as clicks, downloads, or form submissions.
Conversion rate
Conversion rate is the percentage of visitors who complete a desired action on a webpage, such as making a purchase or filling out a form.
How to identify and set my goals?
Now that you know which are the most widely used web analytics metrics, the question is how to actually start evaluating these figures!
But before we get started, the most important thing to say is that what counts as good and what counts as bad depends on a number of different things. It depends on what industry you’re in, how old your site is, and what your main goal is in running your webpage!

My advice is not to think in terms of good and bad numbers but to set your own goals. If you have your own goals, you can always keep them in mind and evaluate your website’s performance accordingly.
S.M.A.R.T. goals
The SMART in SMART goals stands for Specific, Measurable, Achievable, Relevant, and Time-Bound. These are the factors you should always keep in mind when setting and defining a goal.
Specific: Your goal needs to be clear and precise. It should answer the questions “what,” “why,” and “how.”
“Increasing the website’s conversion rate by optimizing the checkout process and improving the website’s loading speed to get more revenue.”
As you see in the example this goal answers all the important questions.
- What? → Increasing the website’s conversion rate
- How? → By optimizing the checkout process and improving the website’s loading speed.
- Why? → To get more revenue.
Measurable: Your goal should have a way of measuring success. This could be a certain number of clicks, conversions, or other actions taken on your webpage.
Let’s illustrate what I mean under measurable in the previous example with one additional piece of information.
“Increasing the website’s conversion rate by 10% by optimizing the checkout process and improving the website’s loading speed to get more revenue.”
Attainable: Your goal should be realistic and attainable. It’s important to set goals that are challenging, but also achievable.
It would make no sense to try to increase the conversion rate in the example by 50%, as this would be a difficult and therefore not really achievable goal.
Relevant: Your goal should be relevant to your business objectives and align with your overall strategy.
For the goal of increasing revenue, increasing the conversion rate is a relevant goal, since the two are causally related.
Time-bound: Your goal should have a specific deadline or timeframe for completion.
Let’s improve even further on our existing goal!
“Increasing the website’s conversion rate by 10% within the next 6 months by optimizing the checkout process and improving the website’s loading speed to get more revenue.”
The time frame of 6 months gives our goal a more tangible reach.
How to determine what figures are good for your website?
Even though I think you can now set proper goals, I’m sure you still have concerns about what is a good value for a metric and what is not! Here are some useful tips for you!

Use historical data
To define the right numbers to reach you should check your historical data. If you look at your old numbers, you’ll see how much you’re usually improving, and what your site is achieving, so you’ll know even better what goals to set for yourself.
Use industry benchmarks
An industry benchmark is a standard or reference point used to compare the performance of a website or business against others in the same industry. Looking at industry benchmarks will give you an insight into what metrics are the most important. It can give you a valuable point of comparison to help evaluate website data.
Keep this in mind!
Also, you should be careful with industry benchmarks. Too high numbers are too high expectations for your website! If you’ve just launched your site, you can’t expect it to perform at the same level as the industry. All in all, just don’t feel bad if you are below the industry standard!
How can you benefit not just from numbers but also from behavioral analytics tools?
If you’re not attracted to numbers and are more of a visual type, you may want to consider using behavioral analytics tools to evaluate the performance of your website.
Let’s look at what behavioral analytics features are available on the market!
Heatmaps
Heatmaps are valuable tools for evaluating website performance because they provide a visual representation of user behavior. By analyzing the data from heatmaps, you can identify areas of your webpage that may be underperforming, such as buttons or links that are not receiving enough clicks. You can also see which areas of the webpage are receiving the most attention, allowing them to optimize these areas for better user engagement.

Session replays
By using session replays, you can see exactly how users are navigating your website, what pages they are visiting, and where they may be encountering issues. If you want to find a visual representation of how your site is performing and exactly how users are behaving on it, there’s no better tool than the session replays.
Did you know?
A web hosting company, namely Rackhost could increase its conversion rate by 15%, with the use of Capturly’s heatmap and session replay features.
I’m not saying that you necessarily need these tools, just that if you would describe yourself as a more visual person, it’s worth considering using them. In addition, these behavioral tools can be an excellent complement to traditional metrics, so you can use them in a unified way to get the best out of your website.
In addition, with behavioral tools, you can also see behind the numbers to some extent, for instance, if you see that a page has a high bounce rate you can use a heatmap or session replay to see what exactly is wrong with that site and easily fix the issue.
What tools can enable me to carry out these analyses?
Now that you know the metrics, the goals, and get an insight into what we mean under behavioral analytics, the most important question is what tools are available on the market and what these tools can offer to evaluate your website.
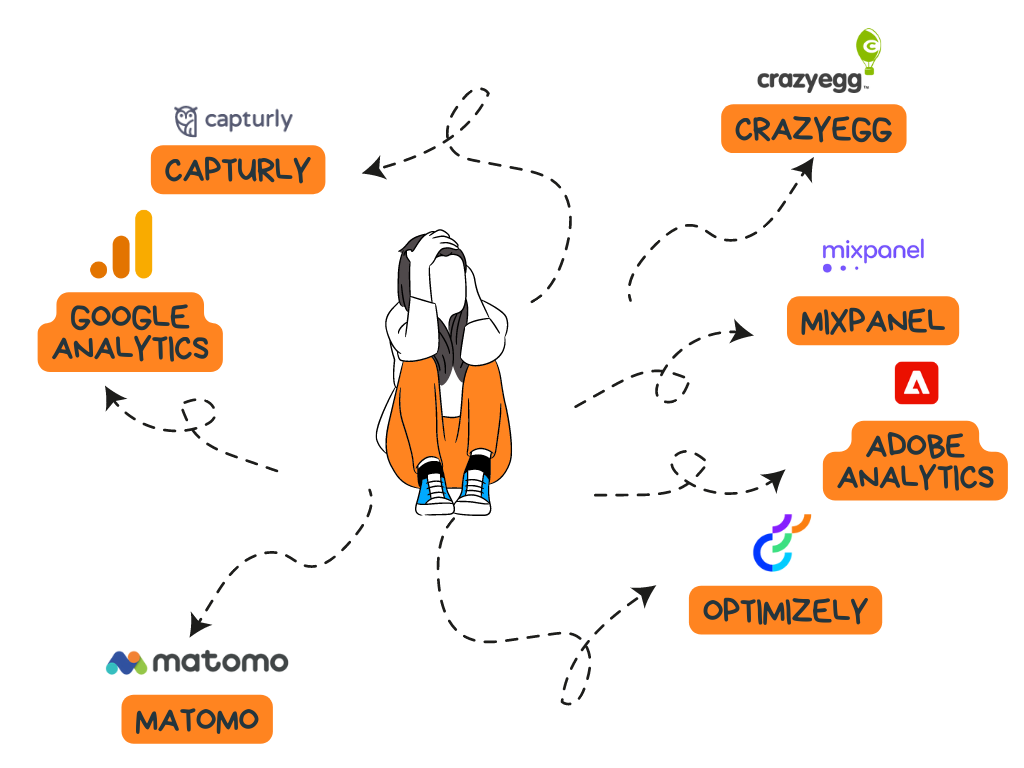
Capturly
Capturly is a tool for analyzing website performance. It contains all the metrics that were already mentioned, like page views, bounce rates, sessions, average session length, and action/sessions. In addition, Capturly also allows you to create conversion funnels to better track your conversion rate and even contains behavioral analytics features like session replays and heatmaps.
Google Analytics
Google Analytics is one of the most widely used tool which can track and analyze your website’s traffic. It provides bounce rate statistics, detailed information on sessions, and session length, including average session duration and the total number of sessions. Google Analytics can also track a wide variety of user actions, including clicks, downloads, and form submissions, and provide data on the average number of actions per session.
Important to note – if you want to learn more about using Google Analytics – that the old version will be discontinued in 2023, so it’s crucial to learn about the usage of the new version!
Matomo
Matomo, formerly known as Piwi is a privacy-focused analytics tool that offers session and session length tracking, as well as other metrics like bounce rate and conversion rate. The tool can also help you with user behavior analysis, goal tracking, real-time reporting, and more.
Optimizely
Optimizely mainly specializes in A/B testing and optimization. However next to testing, it can also measure page views, sessions, average session length, and conversion rate. If your main goal is optimization it is definitely worth giving this tool a try.
Adobe Analytics
Adobe Analytics is not really for beginners, but worth mention it for later use. The tool can measure all the metrics mentioned above, including bounce rate, page views, sessions, average session length, and conversion rate. But it also offers advanced features such as predictive analytics and audience segmentation.
CrazyEgg
Crazy Egg can measure bounce rate, page views, sessions, and average session length. It is primarily a heatmapping tool, but also offers features such as scroll maps and A/B testing. It is worth trying if you want to use behavioral metrics next to the traditional metrics as well.
MixPanel
Mixpanel can measure page views, sessions, average session length, action/sessions, and conversion rate. It is particularly useful for tracking user engagement, retention and offers features such as funnels and cohort analysis.
These are just a few examples of the many tools available for measuring webpage metrics. Your choice of yours depends on your specific needs and how familiar you already are with website metrics in terms of analysis.
Conclusion
All in all, it is impossible to manage a well-functioning webpage without regularly evaluating your website data. It’s essential to set a goal and continuously improve your webpage, and after each change, track the impact of the change on your site’s performance.
Remember, without goals and proper measurements, you can’t really know where you are, what you need to improve on, and where you are doing quite well compared to your competitors. My main advice to you is to start analyzing the performance of your webpage today so that you can stand out from your competitors in the market with the right optimization!