
Nowadays we need measurable data, and website analytics for success: it is indispensable to monitor and quantify the website’s effectiveness and reach. With this – and much more – we help in analytics and data analysis for companies.
People often ask the question “How many have seen my website?” or say “More than five thousand people clicked on my website today”, but this does not necessarily mean that the company successfully uses the opportunities offered by website analytics.
If you really would like to improve the performance of your website you should have an interest in the whole building process and think like a product owner and not just focus on the inbound part. What you need is a well-working, chipped, and up-to-date system that tracks every main moment on your website from a visitor enters until they convert.
But here comes the question, where should you start? The answer is: here and now. What you need to do is basically rewrite the whole process from the bottom up.
Table of Contents
What is Website Analytics?
Website analytics is a complex statistic that allows you to make a precise and customized analysis of the attendance of a website. There are multiple variations of website analytics.
The most popular free website analytics software is Google Analytics, which allows you to monitor not only the number of visitors but also other metrics. By means of metrics, a company can transform its online marketing activity by developing the website to gain more traffic.
In order to effectively use website analytics, we need to understand what measurement and data collection opportunities companies have, and what indicators measure the effectiveness and reach of the pages.
If you are interested in the slide version then here is it!
Why Do You Need Website Analytics?
Some of us just install Google Analytics or any other free website analytics software/solution only to have a look at the statistics once or twice a month. Then things go the same way as before. Others may follow some metrics on a daily basis but ignore the rest. However, you can do so much more to generate revenue.
You can identify certain sources of traffic based on device type, web browser, search engine, social media, etc. This allows you more precise segmentation and more control over your conversion rates. Select the device, that generates the most revenue, or has the lowest bounce rate. Needless to say, this way you can lay your marketing campaigns on a strong foundation backed up by relevant data.
To Find Your Product-Market Fit

Source: mr lee
You can use website analytics to find out exactly what users are looking for on your website, which time they are searching for certain things, and which pages they are searching for. With this data, you can refine your content, and find some topics that you did not present in detail before.
For example, you run a webshop where you sell computer hardware. You also have a blog where you write about all kinds of hardware. If you see that people visit your site after searching for details about a specific manufacturer during the Christmas season, then you might consider running a marketing campaign somewhere around Black Friday on the products of that origin.
To Optimize Your Landing Pages
You can achieve great results by fine-tuning your landing page based on analytical data. The landing page is the first page of your website that users first encounter when they arrive there. Watch your main landing page and optimize it for visitors to spend more time before leaving. The goal is to refine your content to minimize the bounce rate of your website.
To Identify “Pain Points”
If optimizing landing pages is not enough, you can also find out when people leave your web pages. Troubled pages always have higher bounce rates and these are the ones that you need to pay close attention to.
You can test conversion funnels to understand where and why you lose visitors in the process. You can compare your well-converting to the worst, so you can figure out what you’re doing well on one side and what you’re doing on the other.
To Find the Perfect Place for Call-to-Actions:
If you have more than one page where you are using CTAs, there may be one that causes a lot of clicks, and others are performing poorly. The problem is not always the text of the CTA, its size, or its color.
The most common problem is that the CTA itself is perfectly fine, but it’s badly positioned and not where the visitors would expect it to be. The content of your landing page must be consistent with the CTAs if you wish users to click on them. A typical example would be when the call-to-action is located in a popup window that annoys people, so it only increases the bounce rate instead of generating revenue. This is what you should never let happen and website analytics is the right tool for the job.
Where do you start Website Analytics?
In order for the company to decide what is relevant, it has to formulate specific goals. If the company determines its goals, it can help determine if the indicators are the signs of success or failure and help to understand what changes are needed to achieve the goals.
These goals should be as accurate as possible. It’s not enough that you want to increase your website’s traffic by 100%. It’s also not enough to concentrate on search or just direct traffic. In other words, you have to focus more on the main goals instead of blindly following all kinds of basic metrics. Such a goal can be content effectiveness for example.
Website analytics is a great tool for the job because, from the data, the analyst can determine what content the visitor consumes and how many visitors show interest.
Quantitative Measurement in Web Analytics
What does a visit mean to a website? What kind of traffic is a good result? While the latter question may be different for each website (since some sites can be successful with ten visitors a day, while others need hundreds).
To answer the first question we can start with five key traffic metrics for website analytics. One thing is common: you have to find the metric that works best for your business model and strategy.
It is worth noting that there are “universal or global metrics” that are equally important regardless of the type of business:
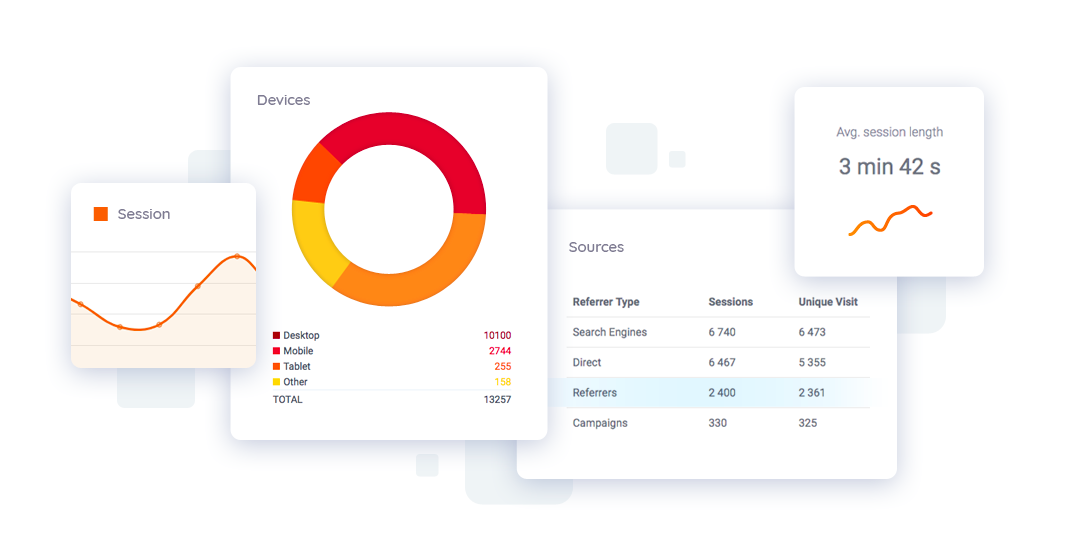
Sessions
This number shows how many visitors interact with your website within a time interval. When someone arrives on your website a session starts and it usually ends a couple of minutes after that person stops the actions.
An action can take all kinds of forms like visiting the website, downloading a file, or filling out a form website. Another example is when the visitor decides to purchase a product, puts it in the shopping cart, then goes back to view the product description again. This counts as two page views, however, it was the same user so the number of sessions remains one. In Google Analytics, the time limit of a session is 30 minutes, and afterward, a new session starts.
Average visit length
As the title suggests it shows how much time a visitor spends on visiting your site on average. The amount can be obtained by dividing all the time spent on the site by the number of visits.
Users/visitors
Users are the people who interact with your website in some way. In addition to the registered user who logs into your website, it is also used as a synonym for the visitors (users of your website) or in other words the people who interact with your website in some way.
In this metric, every visitor counts only once, even if that person has visited the site several times. Users are identified by the cookie used on the computer. For example, if a visitor visits the site five times a month, this metric will count for one person regardless of the number of visits. Users are a very important metric in website analytics.
Page Views
This metric shows the total amount of views of (sub) pages on a website. For example, if a visitor visited the site five times, but viewed ten pages each time, this meter will count for fifty.
If we’re interested in a page visit, we can count the number of page views per visit for a given time period. This data – in itself – won’t be able to tell you how many visits you had on the page or how many times a page was viewed during a session. It’s just an aggregate number of how many times a person has seen a page.
This means that a single visitor could open the page several times and that the site could be viewed multiple times during a session. So if you wish to understand the number of page views, you can do so by taking other data into account.
Bounce rate
Probably one of the most important metrics in website analytics. It shows you how many of your visitors leave your website before interacting with anything.
In web analytics, the bounce rate is bound to the session that started with that particular page. Shortly, it represents a single-page session without any desirable actions. In other words, if you find that a page has a high bounce rate, people did not find what they were looking for. In such cases, you might want to consider what this might be. Can you expect to have a better result and if so, whether the content could be a problem, or there is a problem with design?
Exit Rate
It shows the percentage of exits on a given page. This metric is often mixed with the Bounce rate, however, they are very different.
The main difference between the two comes from the fact that the bounce rate can be interpreted on the entire website and on a page as well, but the exit rate is limited to a given page. Since the visitor will eventually leave your website at some point the exit rate would be 100% if it was an overall metric.
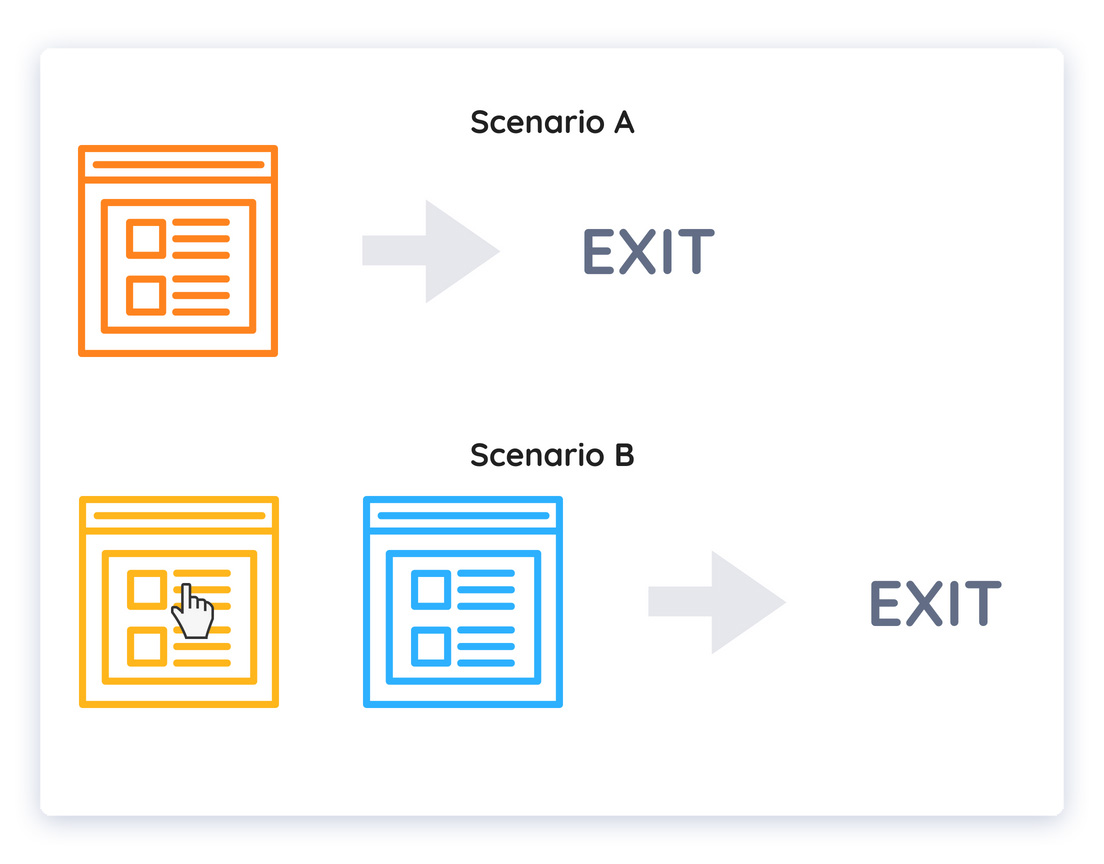
- Scenario A counts as both an Exit and Bounce because the visitor left the website from the first page where he/she landed, without any sign of interaction.
- Scenario B counts as an Exit for page 2 because the user visited both pages and left after page 2.
If the visitor is guided to another page and leaves the site there, an exit is counted but not a bounce. If the visitor leaves the site after a single-page session, then this counts as both an exit and a bounce.
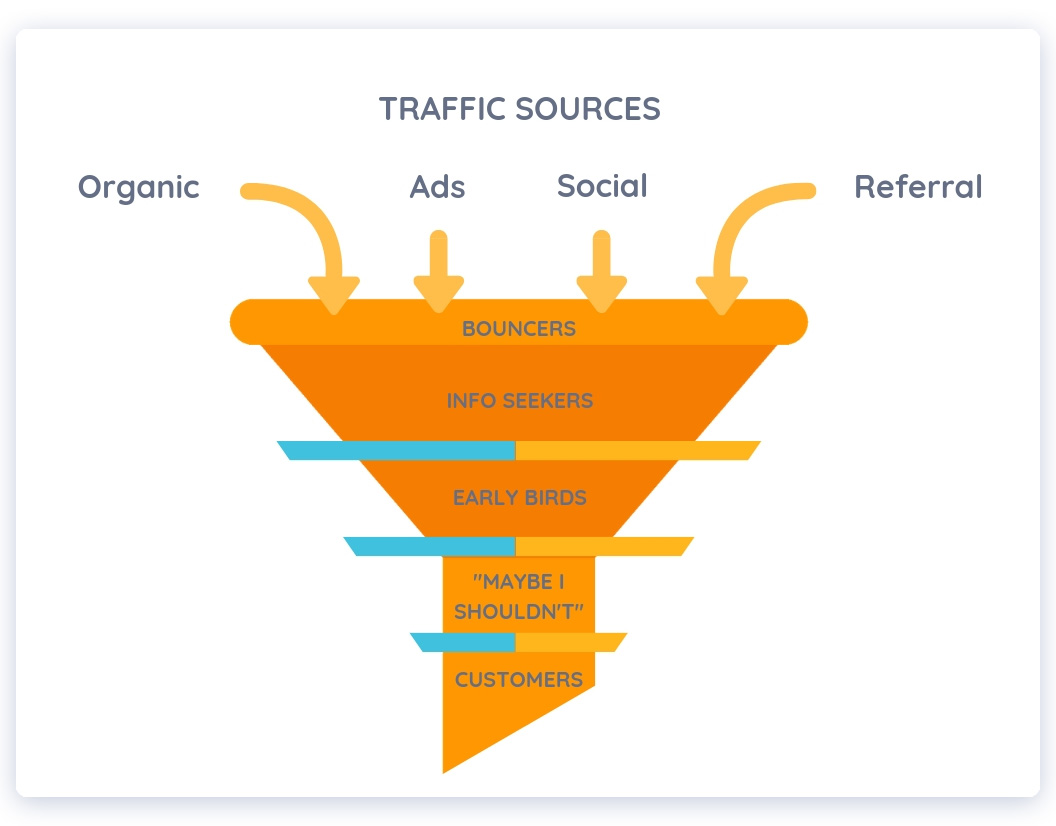
Traffic Sources in Website Analytics

Source: Alexander Popov
A website can get traffic from multiple sources:
Direct
When a visitor opens a web page by typing in the URL or clicking a saved bookmark. Unlabelled or poorly labeled links in a campaign and bad redirects also count as direct traffic.
Campaigns
It represents the traffic from specific campaigns that the company intends to keep track of with the help of website analytics, such as the traffic that comes from links on social networking sites, email marketing links, or direct marketing.
Referral
The traffic that came from another site to your website. This does not include visits from search engines or links from campaigns that are tracked with specific tags. Worth noting that campaigns usually count as referral traffic as they are “referral links” with UTM parameters.
Search
It is traffic from search engines. Google differentiates between organic and paid categories. Organic means search traffic that comes from Google – or other search engines -, for example. Paid refers to traffic when visitors arrive at the website by clicking on the paid advertisement of the website and appearing on the site as a result of the search terms chosen by the company.
Unfortunately, these numbers should be handled with caution by those who analyze the data. One of the reasons is that cookies do not always provide reliable data for web analytics software. Cookies identify new and recurring visitors without a name, but users can either delete these cookies or block them from being stored on the machine so that companies can’t have “control” over the numbers.
Another reason why visit statistics are unreliable is that users bounce between multiple devices. Visits that come from multiple devices cannot be identified by most analytics software as returning visitors because cookies are not yet stored on the second device. Despite these two issues, these statistics are a good source of information for companies to better understand their website traffic.
Qualitative Measurement in Website Analytics
If you already use quantitative metrics you may see visitors that leave your website on a given page without any indication of interest. But why? There are factors that we can not simply cover with basic metrics and there are things that Google Analytics can’t tell you. This is when it’s good to have a website analytics tool that is capable of handling qualitative data.
Qualitative measurements require special analytics solutions such as:
Website Heatmaps
The advanced website analytics tools can draw all kinds of heatmaps on your website. It’s like inspecting your website through infrared goggles. For example, a click heatmap can reveal the most frequently targeted elements of your page. In some cases, you can even separate different sources of traffic on your website and analyze them in detail without interference.
Capturly’s scroll heatmap can show you where you need to place attention to grabbing elements to maintain interest. A good practical example would be when you have a landing page for promotion. With a scroll heatmap, you can tell exactly how long the content can maintain the interest of the visitors by analyzing their scrolling behaviors.
A good tip to increase the scrolling distance is to place emotional attention-grabbing elements – such as faces of satisfied customers, celebrities, etc. – where you see that a little “attention boost” is needed.
Website heatmaps reveal which parts of your website are best placed according to the attention of the visitor, what content, and functions are in good or bad places, and how the user reaches the call-to-action buttons.
From the results you can draw conclusions to improve the web design, ergonomics, and usability of your website, so you can optimize it and make a significant contribution to increasing the number of conversions.
We have created a SlideShare content for those of you who are interested:
Session Replay
Maybe the most spectacular of all. Session replays allow you to track mouse movements, and clicks of visitors to reveal pain points in the conversion funnel. It’s like analyzing a video recording from which you are able to tell what a single visitor is looking.
This is, therefore, a great opportunity since then the assumptions cease to exist, and there is no need to think unnecessarily about whether visitors can use that page, feature, or tool. There is no need to worry about if they will be able to find the precious call-to-actions you have placed on your website. Just lay back and watch the videos and find out exactly what needs to be improved and where. Being able to replay a session and learn from it is invaluable.
Those who wish to use the full potential of website analytics tools, need to know the basic metrics and the reasons behind these metrics. These will help the site owner to determine whether the site is successful or not, in accordance with the predefined goals.
In conclusion, it can be said that the users of website analytics tools have to know how the most important website analytics metrics work, and what defines these metrics by default.
Some tips on how to use Session Replays
Here’s what you should do right after you fired up your session replay tool:
The first thing you should do is perform segmentation on your group of visitors. Identify and separate returning visitors from new ones. The reason behind this act is that returning visitors are already familiar with your website, that way they can navigate through it like there’s nothing wrong. This could lead to false results, so take your time and do not rush this process.
After you detect problems – you will be surprised how many you can find in a single session – do not try to fix all the bugs at once. Take notes, and set up a hierarchy list. Select the problems that have the highest impact on the overall user experience and fix and run usability tests until you are satisfied with the results. Then work your way to the less “game-changing” issues and repeat the process.
Other Useful Techniques and tools in Web Analytics
Conversion Funnels
It’s very useful to locate the dropouts and measure their extent when it comes to an offer, a sale, or a registration process. The essence of conversion tracking is to make the correlation visible between your online marketing actions and the conversions you’ve earned.
A conversion funnel is a representation of how well your website is able to perform when it comes to turning visitors into actual customers. Not every visitor will be converted and this is exactly what you might want to track so you can improve numbers.
Each website has one or more so-called “key user journeys” such as subscription or checkout processes. It is a good idea to identify these steps and find out where you need to improve.
Regardless of the goal, it is important to know how much commercially valuable results you can get in return for investing time and resources into a given goal. However, not everything can be a goal. Only those that are generated as a result of some kind of online process on the website can count. Usually, most of them require some sort of form.
Even when people shop on your webshop is none other than filling out a more complex form. So if your customers are contacting you by phone or email, you can not measure that moment as a conversion. If you think about it, the reason is really simple.
Try and ask yourself the following questions:
- Which version of the ad have they clicked on?
- What was the keyword they typed in the search engine?
- Have they clicked on the paid or organic link in the search engine result list?
Goals in Conversion Funnels
Below you can see some examples that can be tracked as goals:
- A number of requests for pricing.
- Completed subscriptions.
- Completed purchases.
- Participation in events hosted by the company,
- Form fillings in general.
Conversion Funnel Optimization
Firstly, you should carefully separate the campaigns and the content that visitors can access. So if you want to measure a campaign handoff process, you will need to run them from a single URL, a menu item, an unavailable URL, or a subdomain, so that data is not stacked.
Secondly, test only one-way processes! The reason is that if you set up a conversion funnel process where there is a branch – for example, registration, before and during the order – you will not get any useful results at the end of the test.
As they say, knowledge is power. Based on this, you can make responsible decisions about which of your goals bring the most value to your online business. A well-constructed and tracked conversion funnel is and should be the fundamental building block of conversion rate optimization and long-term retention.
A/B testing
Also referred to as split testing, is a technique used in conversion rate optimization that allows you to see which version of the website, landing page, ad campaign, newsletter, etc. performs better. Sometimes the best way to see if something works is by testing it.
Think of A/B testing as an experiment, as you create a modified version from one of your campaigns, website, content, etc., and then run it against the original version. At the end of the test – if you did everything right – you should be able to find out which version produces better results.
With this process, you can exclude the guesswork from your online marketing campaigns, as you no longer have to make a decision about which idea you might want to implement.
A / B tests can come in different forms. The two most common are:
Big A/B Tests
This is the test you should run for a fresh project. In this case, we make version A (that will be the control), and then a bit different version B (which is almost anything other than the control). For example, for an ad, means you are writing a new text and making a new image. So you can test your ideas quickly and with small tests, you just need to improve the best-performing version.
Small A/B Tests
These are more advanced tests you should use if you have data from previous campaigns. In small tests, versions A and B are just one thing apart, so you sure know which picture, headline, CTA, etc. did best.
With a good A/B testing strategy, you can even improve your conversion rate by 22%.
If you want to learn more about A / B tests and their correlation with website analytics, read our A / B tests in the Website Analytics article.
Event tracking
If you are familiar with Google Analytics, then you must have heard about events or event tracking. But what counts as an event is not really clear at this point. With the help of events, you can track every action on your website.
What does this mean? Custom actions can be defined as downloads, mobile ad engagements, loading Flash elements, Ajax embedded elements, video plays, etc. An action can be almost anything you desire.
Each event has something called components. When an event is triggered, each of these components gets a value. Let’s say you wish to know, how many of your visitors click on a wishlist button in a product description.
Here’s what event tracking looks like in Capturly:
trq('set', 'LABEL', 'ACTION', 'VALUE');

<a href="/somelink" onclick="trq('set', 'wishlist_button', 'click', 'add')">Link to somewhere</a>
Label: wishlist_button
Action: click
Value: add
Or you can set up an event to track video engagements such as product demos.
<a href="/somelink" onclick="trq('set', 'product_video', 'click', 'play')">Link to somewhere</a>
Label: product_video
Action: click
Value: play
Goal Analytics

Source: Denys Nevozhai
Goals are highly related to events. The main difference between the two is the following: an event is an actual measurement, that you track, while a goal is a desirable achievement you set and what want to track.
In practice; we can talk about goal completion(s) when there’s a correlation between multiple – various – events. Setting your goals will help you get the data that you can use relatively quickly from Analytics. Many website owners don’t bother with setting goals since they already have concerns about what goals should be set in the first place.
However, goal analytics are useful: they can pass on a lot of extra and valuable information about the behaviors of users. You can determine if people are doing something on your website that you want them to do. In addition, if you set up a conversion funnel, with the help of goal analytics you can observe whether the necessary steps are taken on your page.
Countless goals can be determined, depending on what information you are interested in on your website. However, I advise you to concentrate primarily on the goals that are really useful to you, otherwise, you might end up collecting data that you don’t know what to do with. Of course, you have to think about what to expect from your website visitors. In the end, it all depends on what your website is about and what people want to do after all.
Conclusion
If you wish to succeed in online marketing, you need data. Learning website analytics is something that your business can benefit from. Monitoring and quantifying the effectiveness of your website is a must.
Worth noting, that collecting all kinds of data can be overwhelming, so first make sure to define your product-market fit. If you have access to quantitative data, that’s good. If you care for qualitative measurements also, that’s even better! Thanks to the technologies available today; website heatmaps, session replay, conversion funnel tracking, and A/B testing is right at your fingertips.
8 Comments
API Flight Booking
2023-03-16 at 14:09This information is very helpful. thank you for sharing. Keep Posting.