
It’s like writing that test for which you’ve studied so long. You hope you’re going to get an A+, but want to know the results, and how the teacher sees it. It’s the same with websites. Building a website that looks good and has content is just the first step. The real deal comes after you show the world what you’ve got, and the search engine gives you a grade. If you get a bad one you can cry or do something to correct your mistakes by analyzing them.
Long story short, without web analytics you can’t monitor how your site performs. It’s important to analyze website traffic because without it you can’t measure the effectiveness of your marketing strategy and sales funnel performance. In other words, if you skip this part, you have no clue if the time and resources you are putting in your website are worth it.
So you need DATA!
Easy to say, but where should you start? Where do you get the data from? What kind of data are you looking for?

Web analytics tools can be really overwhelming. You fire up Google Analytics and suddenly you are surrounded by all kinds of metrics telling you something that you probably don’t understand. One thing you have to understand is data is just a pile of numbers.
“Alice: Would you tell me, please, which way I ought to go from here?
Cat: That depends a good deal on where you want to get to.
Alice: I don’t much care where.
Cat: Then it doesn’t matter which way you go.” — Lewis Carroll, Alice’s Adventures in Wonderland
Important metrics you should track
Unique Visitors — they aren’t unique because they are super awesome. The number of unique visitors represents the people who visited your site during a specific time frame. Let’s say a user lands on your homepage 5 times during the week, while another just comes to say Hi once.
How many unique visitors do you have?
Two. Exactly. In order to get the exact size of your audience, you count each visitors only once.
Referrals — If you want to get more traffic from a certain source, for example, social media, you start posting more on the platforms. Web analytics can tell you which platform is the most successful through the referrals.
Bounce rate — A high bounce rate is often a good indicator that something is wrong with your website. A bounce happens when the visitor of your website immediately closes the tab or slams the back button on the web browser. Now, of course, “misclicks” can happen but if your web analytics show a high bounce rate for a longer period, it’s probably a good idea to inspect your funnel and search for leaks. Tools that have built-in website heatmap features like scroll heatmaps, click heatmaps, can make things a lot easier with data visualization.
Note: Don’t confuse this with your “Exit pages”. Exit pages indicate where your visitors are heading. An exit action is triggered usually after the visitor visits more pages on your website. Also, there can be pages producing higher exit rates, for example, a checkout page of a webshop.
Conversion rate — The cool kid on the block. Probably one of the most popular metrics out there. It shows the percentage of those visitors who have achieved a certain goal on your website, for example, got subscribed to your newsletter, completed a purchase etc. If your web analytics show that your conversion rate is low, it means your site is not attractive or somehow you attract people who aren’t part of your target group. The conversion rate can often drop because of usability issues. For example, a company that has annoying captchas on its site could lose out on 3.2% of all their conversions!

Understanding Key Performance Indicators (KPIs)
KPIs are often confused with business metrics. This doesn’t mean they aren’t metrics; they just serve a purpose that is critical for the company.
A key performance indicator (KPI) is a metric that helps you understand how you are doing against your objectives.
Once you have an overall idea on what you wish to achieve, you can start selecting your Key Performance Indicators. KPIs can be defined as a measurement of any business performance. — Who would’ve thought — As a website is an essential part of a modern business we are focusing on KPIs that measure the effectiveness of websites.
Websites can be very different, and companies often take the lazy way and adopt metrics as KPIs blindly, not even bothering to dig a bit deeper.
Example KPIs for blogs:
- Subscriber rate — subscribers are essential for blogs. You can find out how many subscribers you have by creating a simple “Thank You” page that comes up after the visitor went through the whole process, then all you have to do is divide it by the number of unique visitors and BOOM, there’s your rate.

- Ad income per unique visitors — let’s say you have ads running on your blog. In this case, you want to know how those ads perform.

Example KPIs for e-commerce:
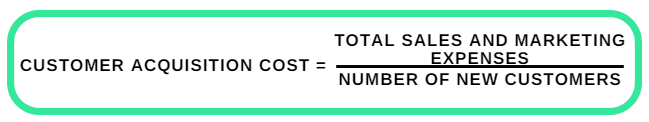
- Customer acquisition cost — It shows you how sustainable and scalable your business is. The “cheaper” the acquisition is, the more profitable the business can become.
- Shopping cart abandonment rate — It can give you a good idea if something is wrong with your site, so you can check it with your web analytics and data visualization tools in more detail.
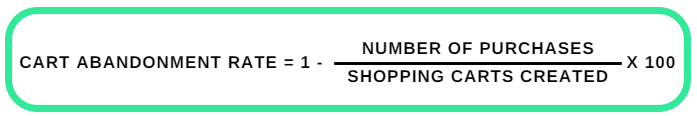
The high cart abandonment rate can be really frustrating for e-commerce site owners, especially during Black Friday or Cyber Monday events. A high rate can indicate bad user experience.
“The top 23 sites all gross over $1 billion per year but have a 44% worse checkout user experience. At the average abandonment rate of 68% each of these sites could be losing $3 billion, if not more.”
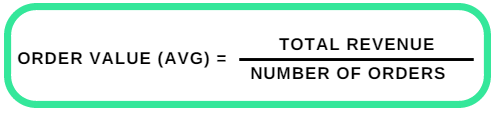
- Average order value —if an e-commerce retailer can increase the (AOV) tends to make more profit, because of the strong correlation.
Track your events right!
When taking web analytics tools into consideration, the track of events is a key to success. Just like with KPIs, it’s up to the administrator to decide which events should be tracked. Events are certain actions that visitors perform on your website. Not only the action itself but the way it’s performed also matters, for example, when the visitor clicks on a Call-to-Action button on a popup. Event tracking can be used in many ways to measure the effectiveness of a website.
You can track:
- PDF downloads
- clicking on Ads
- video engagements (including start, stop, pause)
- chat engagement
- duration of visit on a page
- scroll reach (very useful to know for bloggers, especially when searching for the cause of high bounce rates)
- add to cart
- form completion (poorly optimized forms can drive visitors crazy)
And the list goes on.
The best thing about event tracking is that it’s a powerful and flexible technique at the same time. You can segment your users who performed a certain action so you can re-target them later in a remarketing campaign. It can be used along with other web analytics and data visualization tools, such as a website heatmap — scroll heatmaps, click heatmaps — , visitor recordings, and so on.
Conclusion:
Where does your traffic come from? How are your visitors interacting with your site? What do they think about the overall usability of your site? Can they complete the desired actions in an intuitive way? Are they staying on your website long enough or just bouncing right off? Web analytics can answer these questions by giving you insights into the performance of your website. Your metrics and KPIs tell you how your site is performing, while modern website heatmap tools like scroll heatmaps, click heatmaps can be great additions to your marketing arsenal and even better when paired with event tracking, which delivers greater returns on your investment.
5 Comments
Sewa mobil murah di bali
2017-11-01 at 11:57Very nice style and design and excellent content material, very little else we need :
D.
Sophie
2018-02-06 at 11:58Thanks for your feedback, glad you like it!:)
deepak Pandey
2019-06-14 at 12:38Thanks for this amazing information. Kindly guide me more about this.
Telkom University
2024-01-16 at 14:48How can the worth of website data analytics and visualization be determined in the current industry?