A good heatmap software comes with a toolset that can help you visualize what is happening on your website. Paintings or photos are worth a thousand words and heatmaps are quite similar in nature. They can provide you with an abundance of valuable information you can use to your advantage.
However, you still need some additional tools if you want to understand the overall picture or context. If you want all questions to be answered about the user experience of your digital product, you need to introduce other tools to the equation.
In this article, we are going to talk about how to combine heatmaps with other useful tools while differentiating from eye-tracking.
Table of Contents
Heatmaps as Visual Representations of User Attention
With heatmaps, you can take a look at how your users observe and interact with your website. The reason why they are called heatmaps is simple. They visually represent the areas that grab the user’s attention the most with warm colors.
The less warm the coloration is on the heatmap, the more overlooked that spot was on your page. By understanding the behavior of your visitors, you can make changes that will make your website more user-friendly. If done right, the result will be a more engaging website with a higher conversion rate.
But what are the different ways to measure engagement, actions, and attention that heatmaps offer to us?
There are various ways to reveal user behavior with the help of heatmap software. Below, we are going to talk about how you can see your visitors interact with your website from different points of view.
-
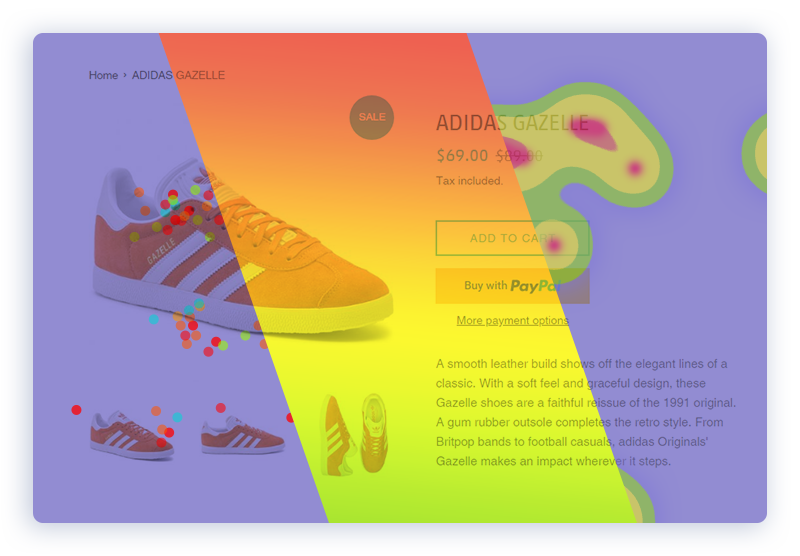
Click maps and Confetti Heatmaps
When a visitor clicks on the web page, the heatmap software saves the position of the clicks. Over time, as more and more visitors click, what you get is a heatmap of clicks. There, you can see which are those spots users click on the most.
It is a visual representation of how people interact with your website with clicks. Now, the difference between click maps and confetti heatmaps is that the former shows you the density of clicks, while the latter shows you each individual click. These individual clicks are shown as dots.
Click maps should be used when you want to figure out whether users are clicking where you want them to. With confetti heatmaps, on the other hand, you can find out whether visitors are trying to click on elements that are not actually clickable.
-
Scroll Heatmaps
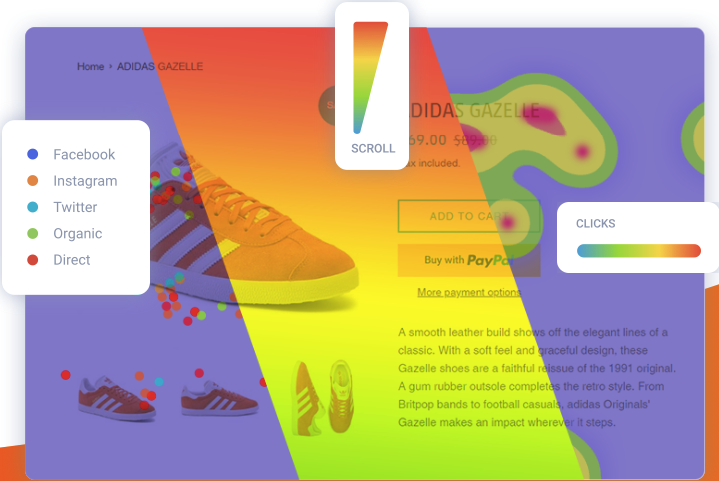
As its name says, a scroll heatmap is going to show you where the user spends the most time on your website while scrolling. You are going to see if they even scroll down or just stay at the top of the page. It is easy to fall into the mistake of cluttering the website with too many elements.
Those can distract your viewers, preventing them from scrolling down to the more important parts. After you evaluate your scroll heatmaps, you can position the content and other elements in a better way. As a result, more of your viewers are going to convert.
-
Measuring Click Percentages with Heatmaps
This heatmap also measures clicks, but in a different way than click maps or confetti heatmaps. With this feature offered by most heatmap software, you can choose specific elements to look at when it comes to clicks. For example, there might be important images or CTAs on your page you want your users to click on.
Quantifying clicks by elements can help you spot elements that most viewers ignore. By improving those elements and positioning them differently, you can ensure that they will generate more clicks in the future. Furthermore, you might discover that many of your users try to click on an image that doesn’t contain a link. In that situation, you can improve the conversion rate just by adding a link to it.
When Should You Use Heatmaps?
Digital marketing is highly competitive and your success largely depends on the quality of data you collect. Creating something awesome without understanding the user is like playing the lotto. If you want to maximize your chances, you need to analyze the behavior of your users and ask for feedback.

A heatmap software provides you with a set of tools that can help you understand user behavior. Here are the three most important qualities that can be measured with heatmaps:
- How engaged users are with your webpage? – With heatmaps, you can see exactly when the user stops scrolling. You might have invested a lot of time and effort into writing an article, yet your readers stop reading it before you even get to the point. When the user stops reading, it also means that he or she didn’t even see the content, elements, or CTAs under a certain line.
- Where do your visitors click? – While looking at a heatmap generated for your web page, you might find out that visitors try to click on areas that don’t even contain a link. Do they click where you want them to? If not, then you might need to change things up a bit. A click map can reveal where your readers get stuck instead of clicking an important link or CTA.
- What grabs the user’s attention? – Heatmaps can help you find out whether users actually care about the clever headlines on your page. You might realize that there are other elements that distract them from your content or the buttons you want them to click on. If your web page is cluttered or your content not engaging enough, you can quickly find it out via heatmaps.
The Problem with Eye-Tracking Compared to Heatmaps
With heatmaps, you can save and analyze input data as long as you have some traffic going on your website. It allows you to track clicks and mouse scrolling as well. With eye-tracking software, you can find out what exactly attracts the attention of your users.
The result is a heatmap in both cases. The warmer the color on an eye-tracking heatmap, the more time the user spent on looking at that particular point. While you only need a software in order to collect data with heatmaps, eye-tracking requires you to invest into technology.
You also need to find users that are willing to participate. For heatmaps, on the other hand, all you need is a live website that people can open up on their computer, at home.
Heatmaps Have Their Own Weaknesses Too
First off, analyzing heatmaps and getting the right information out of them is not always easy. If done right, you can find out a lot about the behavior of your visitors and the usability and functionality of your website design in general.
If you want to deal with that type of data, you need to understand what each data point represents. For example, visitors have a particular goal in mind when visiting your website. Although they might click on a link, that doesn’t necessarily mean they have found what they were looking for.
The reason why they clicked on that link is still hidden. It might be the case that the elements, CTAs, or images were simply positioned in a way so that they click them first. This is why it is important to use other web analytics tools to complement the data you collected with heatmaps.
Also, there are other pieces of data available such as time spent by the user on the web page and bounce rate. You might also need to interview your viewers to find out whether the element in question was actually useful for them. As much as each element should achieve its own goal, viewers need to achieve their own goals too.
Moreover, using heatmaps on a website that has low traffic is not going to provide you with precise data. It rather leaves you with heatmaps that can be easily misinterpreted. Not everyone uses the website the same way, which is why you usually need to let data accumulate over a long period of time.
Using heatmaps on dynamic websites is often not advisable due to the fact that the layout and content change all the time.

How to Combine Heatmaps with Other Web Analytics Tools?
The most effective way to use heatmaps is to combine them with other web analytics tools. This way, you can get a deeper understanding of how your site performs. Although it might seem like you get the full picture by using heatmap software, there are still gaps that need to be filled.
Below, we are going to show you how to fill those gaps by combining heatmaps with A/B testing, traditional analytics, session recordings, and on-page feedback.
-
Complementing Heatmaps with A/B Testing
A heatmap software provides you with a set of tools that help you understand how your viewers interact with your site. Once you have accumulated the data, you can understand many of the strong and weak points of your site.
Given that information can be easily misinterpreted, you might end up making changes that won’t lead to the desired results.
But how can you measure the effectiveness of those changes?
This is where A/B testing should enter the equation. A/B testing is a reliable way to test any changes you have made on your site. There might be multiple ads, web pages, landing pages, and other elements that need to be changed. What you need to do is to create different versions of each and publish them simultaneously.
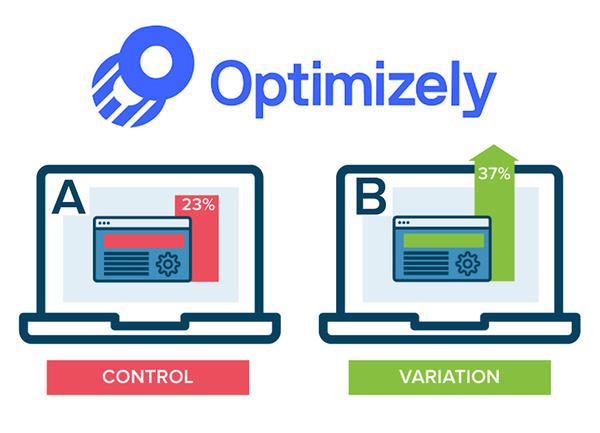
Then, as visitors interact with them, you can measure how each of them performs. This is a great way to combine heatmaps with the experimentation needed to validate changes. Through this 4-step process, you can improve your whole website over time. Here is how it looks like, step-by-step:
- Use heatmaps to identify problems
- Create a testing hypothesis and lay down the solutions
- Test all the possible solutions to those problems with A/B testing
- Pick the solution that performed the best in front of your audience
-
Complete Analysis with Heatmaps and Session Recordings
This is an amazing combination of two in-depth tools that can help you improve your conversion rate. With session recordings, you can analyze the behavior of individual users by looking at the actions they take. While heatmaps are for single-page analysis, session recordings capture the whole user experience from start to finish.
You can watch as the user clicks links, images, navigation buttons, and other elements, transitioning to the next web page. With a heatmap, you can summarize what your traffic is doing on a single web page. By taking a look at numerous session recordings, you can watch how users interact with your website across multiple pages.
Using the combination of these two tools is going to be a two-step process that can be repeated until your questions are answered. Information collected via heatmaps can be further clarified via session recordings.
Are people clicking, tapping, or scrolling for reasons you are unsure about?
The answers might be there in your session recordings. For example, you might discover that users are not clicking one of your CTAs at all after looking at several session recordings.
It is tempting to conclude that all users are ignoring that CTA. However, you can also look at the heatmap generated from that web page and realize that your assumption is not true. One method can clarify the other since they are entirely different while measuring similar data points.
This way, heatmaps and session recordings can complement each other if you use them the right way and with a clear goal in mind.
-
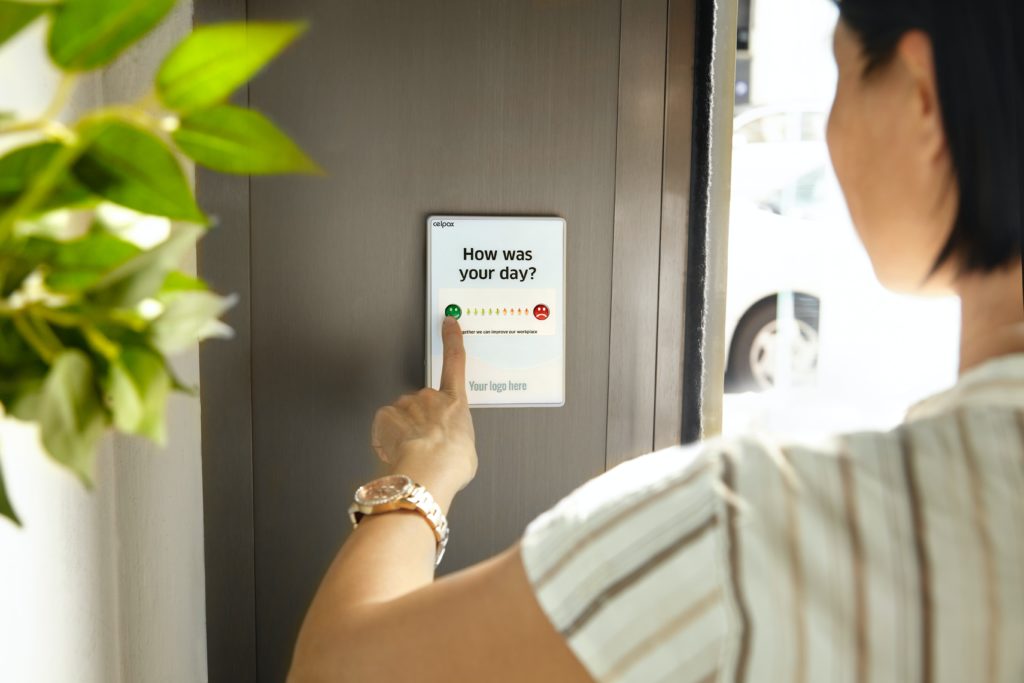
Find Questions with Heatmaps, Find Answers via On-Page Feedback
A simple yet valuable tool available for all website owners is on-page feedback. Let your audience share their thoughts about the usability of your website. This is how quantitative data can complement qualitative data. You can measure various data points with heatmaps and draw conclusions accordingly.
From those conclusions, you can formulate questions. Those questions can then be asked from your viewers via forms or simple elements that contain a single question and a rating from 1 to 5. Based on the answers, you can make the right UX decisions.
With heatmaps, you can reveal most of the design flaws that users face on your website. There might also be design opportunities that you have initially overlooked.
If users are generally lost on your website, you can ask them what is the problem?
After a thorough analysis using heatmaps, you can ask more precise questions. Pop-up surveys can often solve many of the problems that would otherwise bother or confuse your viewers.
-
Combining Traditional Analytics Tools with Heatmaps
Many website owners out there rely on the use of Google Analytics or similar traditional website analytics tools. These tools can potentially reveal some of the most pressing problems on your site. They make you able to collect data about your traffic and various usage patterns.
In a tool like Google Analytics, there are different types of charts to analyze and numbers to compare. However, if you want to deeply understand the flaws of your website, you need that information to be more precise.
Again, it is about asking the right questions based on those charts and then looking for the answers in heatmaps.
What are people looking for on your website?
Which are those elements that make them confused?
Where do they click or scroll on each web page?
Answering these questions can lead you to a better understanding of those charts and numbers generated by traditional analytics tools. There is a reason why those specific metrics occur. For example, you might have a page with high traffic that somehow doesn’t convert.
Find out what those viewers are doing exactly on that page and you will be able to make assumptions on how to change the content or layout.

Final Thoughts
Heatmaps provide you with an outstanding set of tools when it comes to understanding the overall user experience on your website. They make you able to take a look at your own design from the user’s point of view and make changes based on your findings.
However, there is a limit to the variability of information you can get out from heatmaps. If you truly want to beat your competition, you need to use tools that complement each other. Heatmaps used together with traditional web analytics tools, A/B testing, on-page feedback, and session recordings can answer all your questions.
Of course, analyzing such a huge set of data is not easy by all means. You need to know exactly what you are looking for. Also, A/B testing, or any testing for that matter requires a lot of planning. While these are all great tools, there is a lot of data that can be misinterpreted in each result.
This is why it is important to measure the same thing with various tools and then try to merge all the results together in order to understand the whole picture.