
Heat maps are very important tools for graphical designers and for conversion rate optimization. Not only do they look great, but they actually give you some very important information about your website and tell you how you can improve it. That’s why you must learn how to use heatmap.
Heat maps are graphical representations of where the website users click, scroll and move their mouse. They can give you an insight into what the users are thinking when they are using your website. It helps you understand the users more completely and help you delve deeper than just the numbers that are offered by Google Analytics or AI tools.
Scroll maps, Click maps, Segment maps
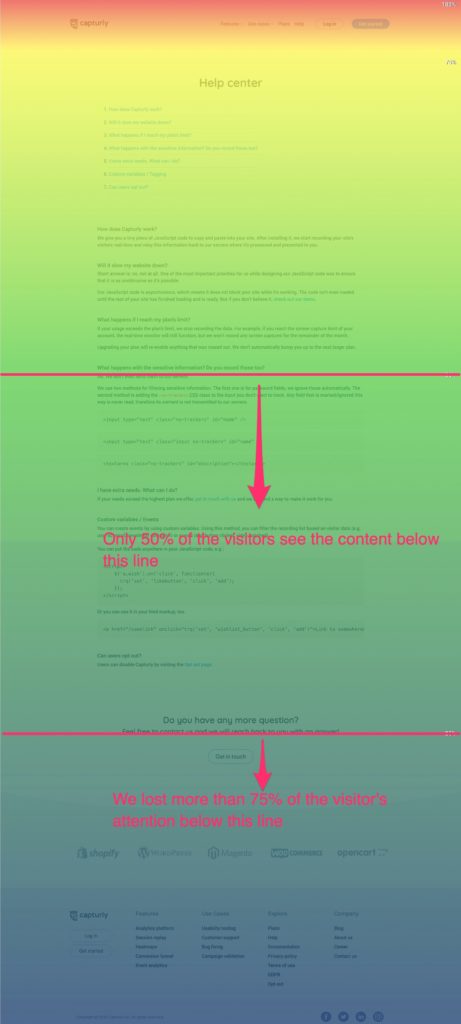
There are three types of heat maps: the first is scroll heatmaps. They are graphical representations of the scrolling mouse movements made by the users, and they help to tell you how far down the site users actually scroll. The scrolling movement is represented by colors – the warmer the colors, the more users scroll to that part of the website. Colder colors are usually at the bottom of the website.
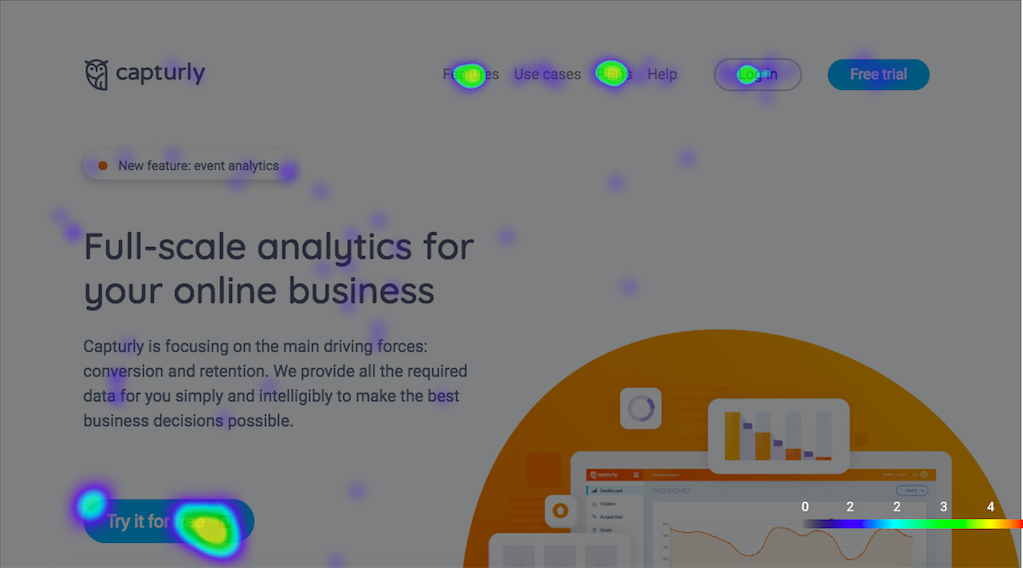
Then there are click heatmaps. These are also very useful as they show how the users use your website – where they click while they are on it. And while this tool does not show the exact movement of the mouse like a session replay does, it rather shows you the clicks on the website. Every click is recorded and put together in a click heatmap. With this tool, you can see which parts of your website are popular – which elements stand out and which ones need more attention.
The last type of heat map is hover maps, which show you the hovering movement of the mouse on the site. They help you show which parts of your site are popular and where the users are hovering with their mouse. It helps you discover the weak and strong areas of your website.
To see the benefits of heat maps, they have to be in place for several weeks, if not months. Let us take a look at some of the benefits that heat maps can bring to you.
5 Lessons that Heatmaps Help You Learn
They will tell you which parts of your site are popular
With heat maps, you can learn which parts of your website are the most popular and which parts need more attention from you. You can learn this by using scroll heatmaps. If you have some important content on your site that you want your users to see, then it is best if you put it on the top of the site, because that is where the users will mostly leave the site.
Scroll heatmaps help you see how far down the site the visitors on your website scroll. The attention span of the viewers is at its peak when they are on the top of the website. The further down the site they scroll the less attention they will put on the actual content. You need to take advantage of that and put the content that is important at the top of the site.
Not only that, but it will help you with conversion rates. You want to put the content that is used to attract new possible users and members of your site to the top, so they can see it and be attentive to it while their attention span is still high.
Not only scroll heatmaps, but also click heatmaps will help you with this. They will tell you which content and buttons or calls to action are actually popular, and which aren’t and need improving. The ones that are popular should preferably be at the top of the website.
The first lesson that heat maps can teach you is which content of your site is good and which isn’t.
They will tell you the why behind the numbers and lower bounce rates
Using Google Analytics alone will not tell you all the information you need to know about your website. Sure, these numbers will tell you important information, like how many users there are, which pages are most popular, where the users come from and the bounce rates, but they will not tell you the reason behind them.
This is where heat maps come in. They will help you understand your users better. You may notice that the bounce rates on one of your pages are very high using Google Analytics, but you will still not know the reason why. Click heatmaps and hover maps can tell you the reason behind it. It might be a broken link or a badly optimized site or just bad design – you will learn the reasons with heat maps and that will help you improve the site to make it more popular.
Heatmaps will help you improve conversion rates
If you are suffering from low conversion rates, and you don’t know why then heat maps might provide you with some insight on that. Especially click heatmaps and hover maps too. It might be the case that your call-to-action material is situated on a bad spot of your website and it is invisible to the users. In this case, you will see that through heat maps. You will want to move that material to a more convenient part of the website where the concentration of clicks and hovering movement is high.
Your call-to-action material might also be broken or badly made. You will see that with click heatmaps. If your material, like sign-up forms are actually getting clicked on and is visible, but you are not getting many users through, then there might be some problem with how the content is made. There might a bug or a glitch, or there might be an error, so you will want to check that.
This is a very important part of heat maps and how they can help improve your business overall.
Your visual material might not be engaging enough
Heat maps will tell you if your visual content is engaging enough for the users to interact with. You might have some pictures on your page that you want the users to see, and you even put a link on those pictures, but nobody is actually clicking on them. This might call for a change of content or in this case, the picture.
It is very useful to know if your visual elements and graphical design, in general, are appealing to the users, as it can be a very important part of keeping the attention of the users. Click heatmaps will tell you if your visual content is good enough for your website – if it is generating clicks. Especially will this lesson be important if your site will lean on this content heavily.

The same goes for links on your site. You will be able to see if users actually use these links on your site. If they are not, you might want to consider changing the layout of these links and where they are situated.
Your site might be too congested and have too much going on
Lastly, heat maps will help you learn if you have a messy site and the users are not actually able to use it properly due to congestion of information on it. Sometimes, less is more. You might want to keep the design and the content simple, but still engaging and easy to use and read.
Your content should be up to date. If there are some old pictures or content on your site, then it will not be as appealing. There might be too much of everything on your site. Heat maps can tell you that information. If the bounce rates are high, you should check the heat maps to see the reason behind it. If there are clicks congested on just one part of the site or if there are no clicks at all, then you should refurbish the site and make it simpler.
Too much information can confuse the users and make them leave your site. So heat maps will help you tell if you have too much of everything on your site and you might want to change that.
Wrapping up
Heat maps are very useful tools not only to improve your conversion rates but also improve your site overall.
Firstly, they will tell you which parts of your site are the most popular and which parts need improvement. Heat maps will provide you with vital information and with insight as to why something is happening. They will also help you improve your conversion rates and lower the bounce rates on your website. Lastly, they will help you improve the visual design of the site – your pictures might not be good enough or the information might be too congested or there might be too much going on.
All in all, heat maps are very useful tools that anyone who wants to improve their conversion rates should use.