Heatmaps can provide informative data about user behavior, however by combining other tools you can get the most out of your analytics strategy!
How to combine traditional analytics with heatmaps?
However traditional tools like Google Analytics or Capturly Analytics provide you with a wide range of charts and statistics about your website, combining them with heatmaps take analytics to a higher level. If you see some outstanding facts in the results of the traditional analytics, heatmaps help you understand the reason for them.
Traditional analytics are not that specific, because they only show summarized conclusions without any explanation. Heatmaps give you a further and deeper review of the user behavior on your website. For example, on the traditional analytics tool you notice that the traffic on a page, where some CTAs are inserted, is high, but the pages that the call to actions refer to have lower traffic. It means that users don’t feel like clicking on the call to actions.
With the heatmap tool, you can learn the main cause of that link not catching the eyes of the users. Altogether, combining traditional analytics with heatmaps lead to more precise results. Traditional analytics answer the question ‘What?’, while heatmap analytics answer the question ‘Why?’.
How to combine heatmaps with session recordings
Firstly, let’s discuss the difference between a heatmap and a session recording. Heatmap is an analysis of a group of users. While session recording guide is based on the activity of one single user. The session recording is completely anonymous and compliant with the GDPR rules. By combining these two methods, you can track the motion of each user on your website.
Session replay doesn’t only record the clicks or taps of a user, it also shows their mouse movements. It does not only record the movements on one page, but it also documents the whole browsing session on that website.
To conclude, the main difference between heatmaps and session recordings is that heatmaps show aggregated data for one certain page, while session recordings show the behavior of one certain user on the whole website. For example, you can learn how far they scrolled or how long they viewed a page before clicking on an item. It is useful for a further and deeper analysis of user behavior. You can also get some information about users coming across any issues while browsing your website.
Session replay can reveal why ‘cold’ spots don’t get enough clicks. By tracking the mouse movements, you can see the reason why users stop browsing before reaching the ‘cold’ spots.

How to conduct A/B tests with heatmaps?
First of all, let’s discuss what A/B testing means. It is a methodology for testing two versions of a website. Each page has an A and a B version, that’s where the name of the testing method comes from. These two versions might be arranged and designed differently.
A/B testing is for comparing the usability and attractiveness of two website models. When users browse your website, the design of the pages varies randomly. The results of A/B testing show the version that increases the user’s activity more effectively. During the effective testing, there is basically only one difference between the two versions. For example, the only thing you change is the color of a button, but its position and the text on it are the same. This kind of testing seems to be a long procedure. So, if you want to completely redesign the page, you can take the tests by changing several elements. But if you’re planning to change just one or two items, it’s better to test them separately.
How to use heatmaps on mobile?
Since more than sixty percent of the searches come from mobile devices, it’s really important to track consumer behavior on touchscreens too. Because of that, heatmaps do not only record clicks, but taps as well. The main role of tap heatmaps is to analyze whether the website is mobile-friendly or if there is something to improve.
Sometimes the optimization of websites on mobile devices isn’t successful. In this case, some information might stay hidden. A heatmap analysis can reveal these hidden objects. The main cause of objects not receiving enough taps may be that they get to another place while optimizing the website. Try to create mobile-friendly pages that fit any screen size, because users are not likely to scroll horizontally. That’s why they might easily skip the elements that are out of their screen size. A heatmap analysis reveals all these errors and helps you with the optimization of your website.
Discover user behavior on your website with our comprehensive tool that combines click, scroll, and segment website heatmaps!
How to compare desktop, tablet, and mobile traffic with the help of heatmaps?
More than 60% of searches come from mobile devices and this rate is expected to be higher. Because of that, it’s not enough to analyze the desktop version of your website, you also need to do that for the optimized ones.
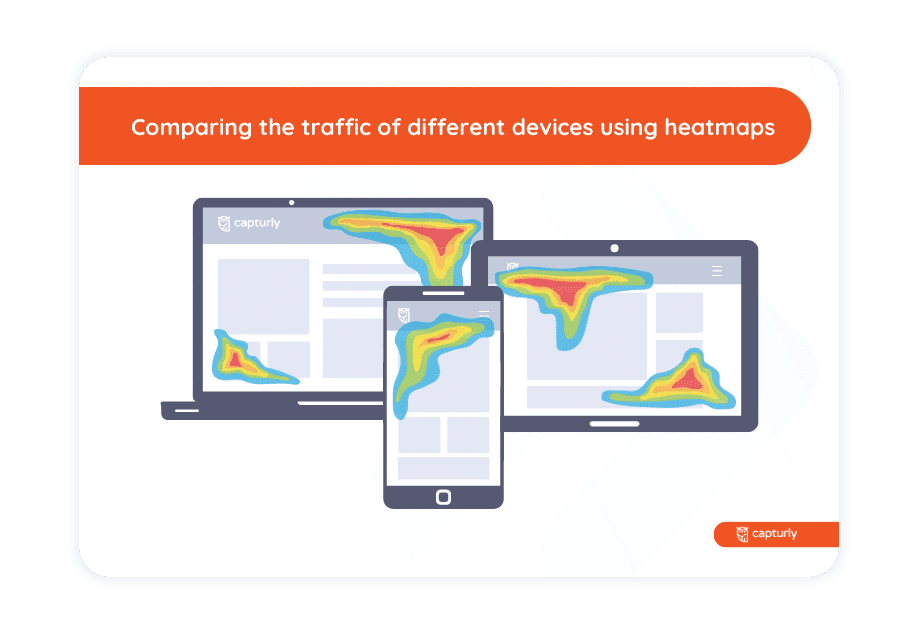
Tablet and mobile traffic might be different from desktop traffic. Mobile devices are mainly used when users need information as soon as possible. They are in a hurry, so they don’t browse or read long articles. Their only purpose is to get what they want in the fastest way. On the other hand, desktop searches may be more decent. Users usually start those searches from home, when they have time to browse the websites. They are more likely to read the whole content on a page or go through the entire selection of a webshop.
Because of this contrast between the usage of the devices, there may be some differences between the heatmap results on them. Since mobile device users need the information fast, they don’t scroll through the whole page. They stop where the needed object is found and then they abandon the website. Desktop users are more likely to click on more objects that do not contain key elements. They can be influenced by call-to-actions more easily since they have more time to spend on the website.
Based on these facts, tap heatmaps might show fewer ‘hot’ spots than click heatmaps. The ‘hot’ spots on tap heatmaps are generally limited to the key elements. In the case of key content that does not appear in ‘hot’ colors, a common reason is wrong optimization. Some elements might not fit into the screen size.

What is the difference between heatmap and eye tracking?
Both methods are great ways of analyzing user behavior. The main difference between heatmap and eye tracking is that heatmap is based on clicks while eye tracking is based on eye movement.
Heatmaps collect information about user behavior by tracking their clicks and scrolling activities. There is no need for special equipment to be able to do that, you only need to sign up for an online service. While eye tracking follows the eye movement of the user. It does not only inform you about their clicks but their eye gaze and fixations. Since it’s a more complicated analytics solution, you need a device called an eye tracker. It monitors all the eye movements made while browsing.
By using eye tracking for analytical purposes, you can study not only the mouse movements, but also the non-clickable elements that catch the user’s eyes. Some objects might detract attention and lead to a lower number of clicks on certain spots. By combining heatmap analysis with eye tracking, you can find a more efficient solution, which helps you to design a user-friendly website.
It’s recommended to combine A/B testing with heatmaps. Heatmaps give you further information about why that version is more attractive than the other. They display the number of clicks or taps on each spot on both versions. You can detect the ‘hot’ and ‘cold’ spots on each of them. For the final solution, combine the most worthy elements from versions A and B. In this way, you can make sure that each object is easy to find.