If I would ask you what kind of analytics you use with your team, you would probably mention Google Analytics in the first place and you would be right. This tool became essential in the past 14 years. According to W3Techs, more than 56% of active websites are using Google Analytics right now, but is the best option your company can have? Does it provide us with all the metrics we need or is it only the brand why we use it?
If you don’t follow any metrics at your company yet, here is an article about why you should do so.
Keeping an eye on the number of customers or the average amount of money people spend in an offline store is essential. Same way as tracking the number of sessions on your website or the amount of time your visitors spend there when it comes to online analytics.
Before we dive into the article, here’s a short summary for those of you who prefer slides:
Advanced website analytics
When it comes to online analytics, the number of sessions on your website or the amount of time your visitors spend there are essential to know, just as the number of customers or the average amount of money people spends in an offline store. Without tracking these metrics, your business is just groping in the dark and your team members are merely relying on their feelings.

If your team would like to plan and make a sustainable business strategy, it’s important to select and follow the right key performance indicators (KPIs). Google Analytics is actually pretty good in this job, besides tracking all of these main metrics, it can also provide your team with the geolocation data, the language, or the main landing points of the website’s visitors. However, despite it’s in development for almost 15 years, it still can’t answer a very important question: why visitors do these certain actions on the website.
This is when behavioral or qualitative analytics come into the picture. These advanced analytics can show you a new dimension of your customers’ activity and let you see the real actions behind the numbers.
Having behavioral analytics is like seeing your customers’ screen while they browse your website.
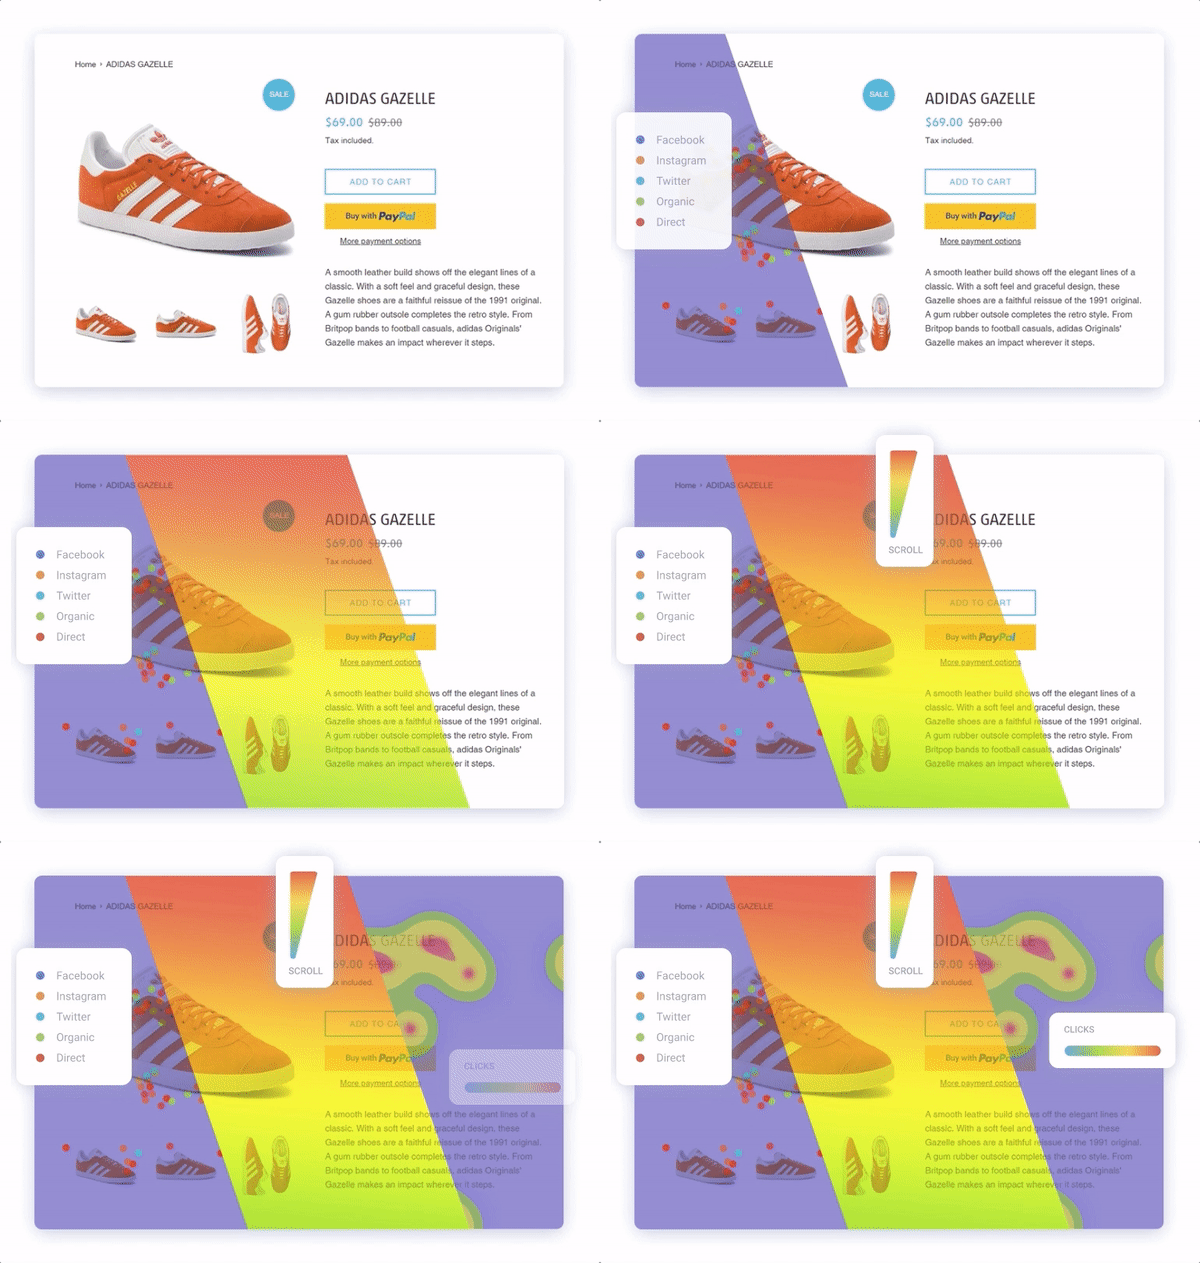
Typical behavioral analytics ranges from session replays to website heatmaps. While session replays are like the video recordings of your website visitors’ activity, heatmaps are the aggregated view of all clicks and scrolls that happened on the website in a given time period. Following these analytics can also answer you the “why has it happened” questions, besides the “what happened” question, like:
- Why do our customers abandon the shopping cart when it contains multiple items?
- Why does a simple registration process take minutes on the website?
- Do our customers check the gallery or the product description first?
With the help of quantitative or numeric metrics, you can have a rough idea of why the conversion process is stuck on the landing page, but what exact actions happened in the background will remain a mystery. In order to improve the customer funnel on your website, it’s important to keep track of your customers’ real behavior and motives instead of relying simply on intuition.
1. Session Replays
Session recording is like watching video recordings of each website visit. It’s an accurate method to learn more about your customers’ journey and understand them more. It’s the perfect tool to identify pain-points in your customer funnels, like misleading links, malfunctioning galleries, or hard to understand creatives on your main page.
In what other cases can my team use session replays?
- Identifying bugs just as they happen
- Providing a faster and more complete customer support
- Helping the campaign validation process
- Identifying behavioral differences by niche audiences

2. Heatmaps
While Session recordings play you the exact visits of your website back, Heatmaps are an aggregated view of your website’s clicks and scrolls. It’s like a summary of the session replays in a given time period. In Capturly, you can distinguish three different types of heatmaps. Besides the click heatmaps and scroll heatmaps, your team can also follow where your customers clicked by source channel called segment heatmap. Heatmaps are the perfect tool to identify dead areas, ignored buttons, or unnecessary links on your website.
In what other cases can my team use site heatmaps?
- Help your team to find unclickable contents on your website
- Receiving additional data for usability testing
- Supporting the bug solving process
- Validating responsivity of your website

3. Event Analytics
Besides the behavioral data, your team can collect all your custom events in Capturly as well. It means, that your team can now have all the desired session replays at their fingerprints. In addition, you can filter the custom events or other parameters like the source or country with a single click. Having all of these data in the same tool means a new level of business insights, it will make your product and support teamwork faster and in a more effective way. It’s a new level of business insights you can earn. Just imagine this can make your team’s job a lot easier.
Wrapping up
Having Google Analytics is essential, as it’s a great tool to help your team with the main metrics to follow and set your KPIs, but adding behavioral analytics to your current toolset can lead your business to a new level. Let your team see the exact actions of your customers will not just assist you to optimize your website better, but it will be also a great help in having a better understanding of your customers.
Don't forget, sharing is caring! :)

