Ever since the pandemic upended our world, businesses across multiple sectors are fast evolving to drive successful digital transformations. They have more or less learned to work and thrive online, help their workforce find a balance between work and home lives, and still drive greater profits.
The rise in online activity naturally resulted in a massive spike of data that businesses can collect, use, and analyze for various purposes:
- to boost sales
- understand the intended audience and target markets better
- refine their products and services
- and so on.
However, the inflow of data puts forth a new challenge (and a huge opportunity – depends on how you see it) for businesses: how do they convert this wealth of new data into actionable insights? With the help of data analytics, of course.
It is true businesses are not shying away from leveraging different ways to record and utilize data for making better business decisions. And data analytics presents them with a platform to extract value from the sheer scale of data.
Table of Contents
But what is data analytics?
Data analytics is the process of analyzing raw data to retrieve meaningful and actionable insights, which can be used for informing and driving smart business decisions. Besides, it refers to the tools and methodologies that come into play for processing data.

From manufacturing and marketing to automotive and green energy to education and human resources – all sectors use data analytics in some way or another. According to Splunk, companies that emphasize much on data experience an annual increase of 5.32% on average.
HBR reports that 74% of business leaders expect long-term productivity gains by making data insights available to frontline employees. Data analytics helps businesses develop robust advertising campaigns, modify offerings ahead of the curve, and enhance client relationships.
This is not surprising since 2.5 quintillion data bytes are created every day. This statistic will only increase as the Internet of Things (IoT) in data analytics takes center stage and businesses rush to understand the emergent complexities of data management.
Unfortunately, not all is hunky-dory.
A Deloitte study says that 67% of executives are not comfortable accessing or utilizing data with the existing tools and resources, and 55% of data collected by businesses is never used. There is a greater need to resort to data analytics so that businesses know how to use data the way it is supposed to.
Types of data analytics
To understand dive deep into the concept of data analytics, it is imperative to find out the different types of data analytics:
1. Descriptive analytics
Descriptive analytics answers the big picture questions and helps create a summary of the large data sets. It helps businesses discover essential information using data visualization and analysis. IoT-based data analytics revolves around that.
2. Diagnostic analytics
This type of analytics explores information received from descriptive analytics in greater detail. Diagnostic analytics helps identify anomalies and trends by leveraging data science – a field of study that combines programming skills, domain expertise, and knowledge of statistics to fetch meaningful insights from large volumes of data.
3. Predictive analytics
It is a branch of advanced analytics that forecasts outcomes using historical data combined with statistical modeling, ML, and data mining techniques.
Businesses utilize predictive analytics for finding patterns in the data to identify risks and opportunities in their business and customer life cycles.
Components of data analytics
There are essentially four methods you can opt for to process any set of data, including:
1. Data mining
Data mining breaks down vast volumes of raw data into granular chunks of information for use. It also helps identify anomalies in data groups and assesses the dependencies between different data groups to arrive at correlations between them.

2. Data visualization
As the name suggests, data visualization lays down data visually for better assessment. In simple words, it makes complex data easily understandable – even by a novice. This could include pie charts, histograms, bar charts, and graphs.
3. Text analytics
Simply put, text analytics is used for predictive typing for your emails and developing auto-correct for your phone. It processes enormous chunks of unstructured texts for building algorithms, including linguistic analysis and pattern recognition in textual data.
4. Business Intelligence (BI)
BI comprises technologies and strategies used by businesses for data analysis and business information management. It helps detect industry trends, monitor customer behavior, and monitor public sentiment. BI is useful in product placements and fixing product or service pricing. It uses visual tools such as pivot tables and heat maps to do the job.

Data analytics v.s business analytics: Common differences
Contrary to popular belief, the two terminologies differ by leaps and bounds despite manipulating data, extracting insights from it, and using the information to enhance operational efficiency. You may think – they basically do the same job! No.
So, how do data analytics and business analytics differ from each other?
Data analytics
Data analytics involves sifting through enormous data sets to identify patterns and trends and arrive at conclusions about hypotheses, which, in turn, help make business decisions.
With the help of data analysis, companies can answer questions like, “What is the likelihood of the customer switching to a competitor?” or “What is the influence of political unrest in a country x on consumer preferences?” It leverages various techniques like data modeling, data mining, and data science.
The analysis is more ad-hoc, with data sources added on the go as correlations are uncovered. Data analytics is typically more predictive than prescriptive because it aims to find answers to specific questions and discover new insights for competitive advantage.
Business analytics
On the other hand, business analytics focuses on managing the more significant business implications of data and its actions, which could be developing a new product or prioritizing one task over another.
Business analytics supports continuous improvement in technology and operational processes. The data sources are defined in advance based on project goals or company objectives. This form of analytics is more retrospective and descriptive.
Common business analytics team members include:
- CDO
- CIO
- business analysts
- data warehouse engineers
- and so on.
Let us say data analytics is a more niche version of business analytics.
To perform data analysis, you need an algorithm to find out the patterns in your data and determine which variables are crucial and which are not for the sake of your business outcomes. Data analytics utilizes machine learning to predict datasets better and give more accurate results.
Data analytics in digital marketing
Understandably, the core of digital analytics revolves around its ability to spot patterns. Given the number of marketing sources we have now – social media, email, website traffic – it is only viable to have a robust tool that can help you gather all data points and make sense of them.
For instance, businesses can carefully study their site visitors and optimize the site’s user experience and flow. Similarly, by collecting data about products similar to another business’ products, you can adjust your pricing for a more competitive edge.
How data analytics can boost your business in the digital world
In the digital world, data analytics is beneficial as it offers many advantages to businesses. In the current times, you certainly cannot thrive without studying and leveraging data for the betterment of their operations, we should learn of different ways that data analytics helps:
1. Customer experience
As businesses have become more digitized, the amount of customer data available has also increased in a short span.
You can now combine location, chatbot interactions, the Internet of Things (IoT), mobile app solutions usage, and social media marketing feeds with data from transaction histories, phone calls, email conversations, chats, and in-store interactions.

These channels, on combining, can capture tons of data comprising valuable insights into where and how customers like to engage with businesses. For instance, if specific customer questions are being asked to chatbots, it makes sense to make adjustments accordingly and offer customers a higher level of service by giving access to widely-asked questions.
Another example could be highlighting errors that occur on your website from your end in the JavaScript code. Catch these errors with Capturly’s new JavaScript tool, which was designed to help you find and fix them.
2. Risk mitigation
The use of data analytics is not just restricted to identifying and predicting business opportunities. In fact, it also highlights potential risks and helps businesses or departments take preventative measures.
For instance, retail chain companies can apply statistical models based on crime data. This way, they can determine which of their brick-and-mortar stores are at the highest risk of being targeted by shoplifters so they can increase security accordingly.
Similarly, data analytics also highlights financial risks. Data can limit losses by determining the optimal price for selling older stock.
3. Enhanced security
Data security threats are not uncommon these days. Even though no business can predict the future, especially where security threats are concerned, deploying analytics tools to analyze security events helps manifold.

With the help of such tools, it is possible to detect a threat before it even has a chance to impact your infrastructure and bottom line. For instance, monitored network traffic can be used to identify indicators of compromise or abnormal behaviors and take remedial measures before an actual threat occurs.
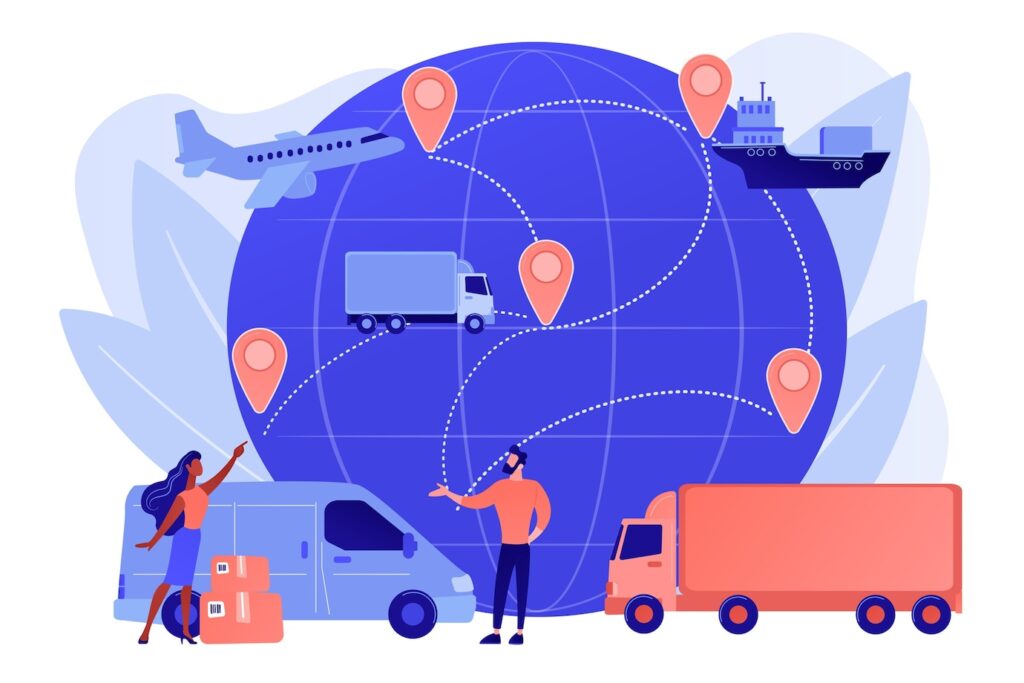
4. Streamlined supply chain management
Businesses can improve operational efficiency through data analytics by collecting and analyzing data about the supply chain. The data can show where production delays or bottlenecks originate and help forecast where future problems may arise.
For instance, if a demand forecast shows that a specific vendor would not be able to handle the volume for product “A” required for the holiday season, you could find a replacement for the vendor to procure that product and avoid production delays.
In the world of retail, many businesses struggle to maintain optimal inventory levels. Data analytics comes in handy for ensuring an optimal supply of all products based on multiple factors, such as:
- holiday seasons
- seasonality
- consumer behaviors
- and so on.
This type of analytics prepares you better to run your business. Who does not want that?
5. Better business opportunities
The most obvious benefit of data analytics is that it helps spot key business opportunities.
This is usually done in two steps. First, predictive analytics helps suggest what may happen in the future based on collected data. Afterward, prescriptive analytics can indicate how your business should react to those predicted changes, trends, or opportunities. For example, your business can adapt its offerings and pricing based on customer data and directly increase sales.
Ecommerce giant Amazon showcases product recommendations on the homepage for every repeat visitor that comes back to their site or mobile app. These suggestions are based on what they browsed through or bought in the past.
Steps involved in data analytics
Now that you know data analytics, its major types and components, and how it can help enhance your business in the digital world, have you ever wondered what steps are involved in data analysis? Intrigued? Come, let us have a look:
Imagine a scenario: You have a successful eCommerce firm with 1 million customers in your kitty. Everything is excellent, but you cannot just yet be relaxed or put up your feet. There are still specific chinks in your armor that you would like to rectify. OKAY!
You want to identify specific problems related to your eCommerce business and develop custom data-driven solutions for business growth. Here are the five concrete steps you will follow to achieve your goals via data analytics:
1. Understand the problem
First things first – what are the most visibly common problems in your operations? Ecommerce firms often face issues, like:
- predicting the return of items
- number of canceled orders
- vehicle routing optimization
- fraud identification
- and so on.
What is it that is troubling you? What needs fixing?

2. Collect the data
Gather transactional business data and customer-related information from the last few years. This way you can address the problems your business is facing. The data can have information about the total units sold for a product and the profits made in a specific timeline. Even customer feedback from your email surveys! Past data plays a critical role in shaping the future of the business. Therefore, fetch as many data sets as possible.
3. Clean the data
Not every data set you gather will be worthy of analysis. In fact, when you choose the data, it will most probably be in a messy and disorderly state. Some data sets will not be suitable or relevant for any analysis and thus must be removed from the mix. Clean the data to remove redundant, unwanted, and missing values and prepare it for analysis.

4. Data exploration
Once the data gathered, has been cleaned and prep, execute exploratory data analysis. Make use of data visualization, data mining tools, and business intelligence technologies to analyze and predict future outcomes from the data sets. There are specific outcomes you can expect on completing the step for your eCommerce firm. You can:
- Determine when a customer purchases the next product.
- Predict the sales and profit for the next quarter.
- Calculate the shortest route to deliver the product.
- Identify how long it takes you to complete a shipment.
5. Interpret the results
The final step is interpreting the results and checking if the outcomes meet your expectations. Also, you can discover hidden patterns and future trends, which will help you supplement your business decision-making.
Top data analytics tools
Now we understand the various steps that are a part of a typical data analytics process. To begin you journey, let us discuss the top tools to use for undertaking this function:
- Tableau helps develop various visualizations for presenting data interactively and building reports and dashboards for showcasing business trends and insights. It offers limitless data exploration capabilities without interrupting the flow of analysis.
- Apache Spark is an open-source data analytics machine that helps process data in real time. It carries out sophisticated analytics with the help of SQL queries and machine learning algorithms.
- R is an open-source programming language used for statistical and numerical analysis. It helps in data analysis and visualization.
- Power BI, as the name suggests, is a business intelligence tool with an easy drag n’ drop functionality, which supports various data sources and helps you ask questions about your data, fetching immediate insights.
- SAS helps visualize data, write SQL queries, and perform analytics that helps create machine learning models for predictions and forecasting.
- Python, an object-oriented open-source programming language, supports various libraries for data visualization, modeling, and manipulation.
Over to you
The world of data is truly fascinating. Data analytics helps businesses make sense of vast volumes of information for development. Statista reports that the global Big Data market will be valued at $103 billion by 2027. The future of data analytics is bright!
With a share of 45%, the software (data analytics tools) segment would become the large Big Data market segment by the same year. How is your business benefiting from data? Are you taking help from any data analytics tools?
Surely, the above-mentioned processes and tools will help you gain the most support from data analytics. If you have not yet given data much emphasis, now is the time to start, lest you want to get left behind. All the best!
12 Comments
Disha
2023-02-13 at 09:44Very informative blog. Facts and information explained briefly.
Expedia API
2023-02-15 at 08:53Thanks for an amazing unique blog.
sunita
2023-02-20 at 08:10I like your blog post. it’s very useful & informative. thank you for sharing Amazing Content.
Anil
2023-02-21 at 09:35I read several articles on the internet, but your article provides the precise information that I was looking for.
Rohit Sharma
2023-03-14 at 12:50Great blog post on the importance of data analytics in the digital world! The article does an excellent job of highlighting the role of data analytics in driving business growth and improving decision-making in today’s fast-paced digital landscape. The use cases and examples provided are very insightful and help to illustrate the practical applications of data analytics in various industries. Overall, a must-read for anyone looking to better understand the importance of data analytics in the digital age.
M.Reema safreen
2023-05-19 at 08:46l gain more knowledge about this..
very useful to every business.. based on data analytics.
hardscape companies Leawood
2023-05-22 at 16:20The most obvious benefit of data analytics is that it helps spot key business opportunities. This is usually done in two steps. First, predictive analytics helps suggest what may happen in the future based on collected data.
Sumit agarwal
2023-05-23 at 10:00Thanks for this blog this very great informational blog and I resolve My all queries with this.
M.Reema Safreen
2023-05-24 at 07:20it’s very useful to me..
l gain more knowledge about this..dataanalytics
M.Reema safreen
2023-05-26 at 07:00it’s very useful to me.
l learn about this dataanalytics
Gurpreetsingh
2023-06-29 at 09:27“Absolutely! Your questions are great and demonstrate a genuine desire to learn. It is refreshing to see someone actively seeking out knowledge and engaging in meaningful conversation.
Manish
2023-10-19 at 09:58thank you for sharing information!