Did you know that there are nearly 3.5 billion active social media users in the world? That is a number that can no longer be taken lightly on the business side.
That’s why social media platforms are playing an increasingly important role in the marketing activities of companies, be they successful small and medium enterprises, large corporations, online businesses, or brick, and mortar stores. But nowadays, it is not enough to be present on the plethora of social media platforms. We need to know where, when, and how to be present on them.
In this article, we will show you how behavioral and qualitative analytics can come to the rescue, how you can use website heatmaps on your social media sites, the features of each platform, and exactly how you can benefit from the potential of behavioral analytics.
Sounds pretty interesting, doesn’t it? Then let’s get cracking!
Table of Contents
The Main Social Media Platforms for Businesses
First, we will introduce you to the social media platforms that are most relevant to your business. Chances are that the most optimal social networking sites for your business are not the same as the ones you use personally in your everyday life.
That is why we will take a look at the most popular social media platforms and their characteristics.
Regardless of age, gender or industry, Facebook is one of the most popular platforms worldwide. With 2.7 billion monthly active users and $86 billion in revenue, it is undoubtedly at the top of the league.
Financial services, ecommerce, retail, gaming, entertainment, media, telecom, technology, consumer goods, and automotive enterprises are among the most popular industries on Facebook.
While the algorithm progressively suppresses business posts in the News Feed, there are still ways to increase engagement without spending money on ads.
To increase your engagement, think about joining (or building) groups, using a Facebook Messenger chatbot, or using live video.
Instagram a.k.a the world of hashtags is a social media platform that is ideal for product-based businesses, influencers, and instructors with 1,16 billion monthly active users and $6.8 billion in revenue.
Instagram is a gold mine if your target group is under 35: 75 percent of 18-24-year-olds use the platform every day, with 67 percent of Generation Z and 57 percent of Millennials.
Ever since the launch of shoppable posts in 2018, not only can B2Bs engage with a large audience, but they can also link product information and purchases directly from the Instagram platform.
Youtube
YouTube is the first video social media network, and it has a stronghold on the industry, with 2 billion monthly active users.
With 73 percent of US people using YouTube, the platform’s reach potential is unparalleled. There are some numbers that can not be ignored.
YouTube has a large user base that spans all generations. With 38 percent of US people utilizing the site, it is second only to Facebook in terms of reaching the difficult-to-reach 65+ group.
YouTube offers a wide range of topics, including beauty, gaming, education, and home improvement. Most companies should invest in this platform, as video is the fastest-growing channel for content marketing.
Since its launch in 2006, Twitter has grown to 353 million monthly active users, reaching annual revenue of $3.72 billion.
If your company is in the entertainment, sports, politics, technology, or marketing industries, you stand to get a lot of attention on Twitter.
Brands have the chance to develop and polish their voice on Twitter. Join the never-ending dialogue by jumping into threads, adding value, sharing your own and others’ material, and providing value.
Pinterest has 416 million monthly active users, reaching an annual revenue of $1,693 million. Fashion, cuisine, décor, weddings, workouts, and DIY-related pins are among the most popular on Pinterest.
Furthermore, anything with high-quality and engaging visuals can do well on Pinterest.
81 percent of Pinterest users are female, which is a strong incentive to invest time in social media marketing on Pinterest if you have a primarily female audience.
But this does not mean that male users should be forgotten, as; in fact, men account for 40% of new Pinterest signups.
After reviewing the most important things to know about the different social media platforms, it is worth moving on to the importance of behavioral analytics.
Why Behavior Analytics is Important

Data analytics is a technique that works with unprocessed event data. Let’s talk about behavioral data for a moment to help you grasp it better.
When a user interacts with your company online, raw event data is generated. A simple swipe, click, or navigation to and from your website, as well as other user activities, may be used to engage users. These activities are saved as events that are linked to users and other information such as device, location, and so on.
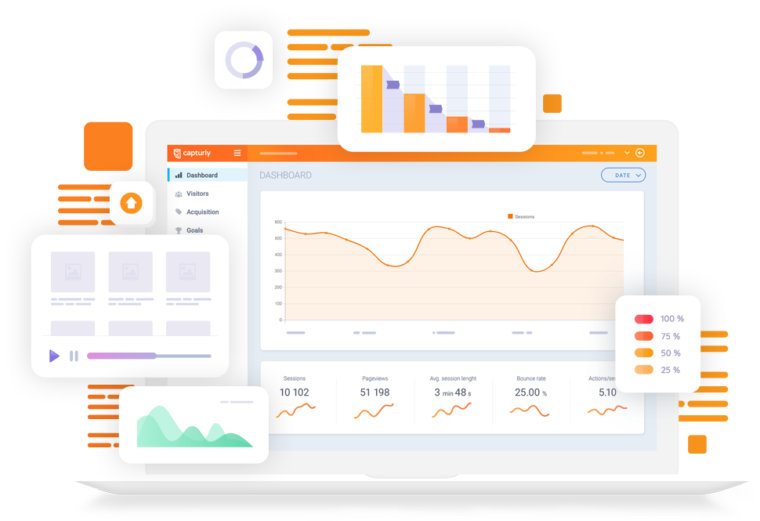
Teams can utilize session replay, heatmaps, or any other web analytics technology that best suits their needs. This information can be gathered in its entirety to provide the relevant team with a picture of the users’ activity. By analyzing user flows and behaviors, we may gain a deeper knowledge of our users.
Understanding customers and boosting engagement, revenue, and conversion rates are key uses of behavioral analytics. Amazon is an excellent example. Its site is constantly tailored to past searches and actions.
Analysts and marketers utilize this sort of data in many types of businesses. It is up to management to decide how to use the result after summarizing and reporting.
But how can we collect such data? The answer lies in heatmaps.
What Are Website Heatmaps?
To start off, let’s explain what heatmaps are.
They are analytics tools that help you understand the behavior of your users. With them, you can track your users’ clicks, mouse movements, and scrolling movements that they make on your site. And that can be very beneficial for your website, especially if you are running an e-commerce website.
As we already said, they can tell you the whys behind the numbers. In most cases, they will provide you with valuable qualitative information that will allow you to optimize the whole experience on the site.
Types of website heatmaps
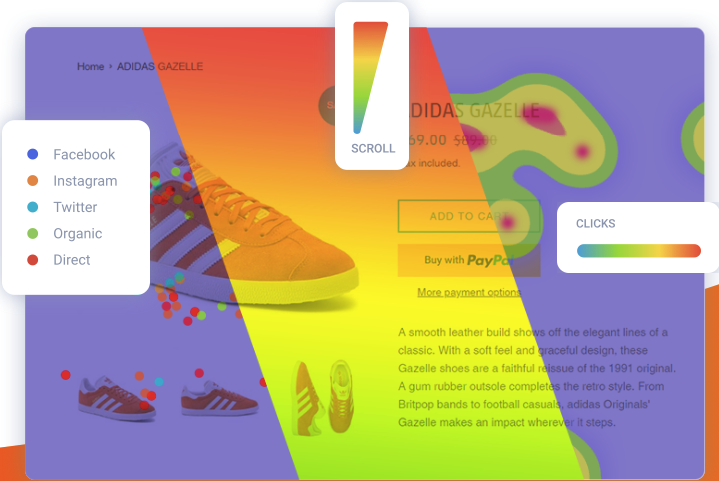
In essence, there are three types of website heatmaps: click heatmaps, segment heatmaps, and scroll heatmaps.
- Click heatmaps tell you exactly where the users have made their clicks on your website. They show you where most of the clicks are concentrated on your website, including frustrating clicks that can happen if your links are not working. They help you recognize which elements on your site are the most popular and most clicked.
- Segment heatmap is your tool in case you want to filter your visitors based on the traffic source. With segment heatmaps, you can compare different segments to see how they behave. Traffic sources can be browsers, operating systems, physical devices, or websites.
- Scroll heatmaps allow us to see how far the users tend to scroll down our site. These will help us understand where the interesting content lies, and where the users tend to lose interest as they scroll down the webpage.
Data visualization like graphs, infographics are essential these days. Heatmaps are usually represented by colors. These will tell us more about user engagement, and each type of heatmap will have different measurements when it comes to colors.
Usually, warmer colors indicate a stronger engagement from users, while the colder colors tell us the “weak” parts of our website.
What is Website Heatmap Analytics for?
Now that you have got an overview of heatmaps, you may wonder why your website or social media page could benefit from them.
Heatmaps assist you in locating various areas on any social media website where users spend the most time or do the most activities. They are a wonderful method to see what individuals do once they have been referred from a social networking site to your website.
Because they are visual in nature, they are easy to examine and can show you which parts of your website require urgent improvement.
Heatmaps can help you understand why visitors from a specific social media campaign are not converting when it comes to assessing the success of your social media efforts. You may simply tweak your website to meet the specific demands of your target audience and improve conversions in this way.
Heatmaps may support you in optimizing your content so that you can create dynamic content tailored to your visitors’ specific demands. The age of “one size fits all” content is passed, and businesses are searching for fresh methods to improve the user’s entire experience. You can enhance the general structure of your website and eliminate the dead zones that serve no use.
If you are interested in how we can explore the potential of heatmaps as a focus for social media platforms, read on!
How to Analyze User Behavior on Social Sites
If you are still not quite sure what to look for on your social media platforms using heatmaps, this chapter is for you.
Track Below-the-Fold Scrolling
Some in the design and marketing industries may claim that below-the-fold scrolling is unimportant. However, this is not always the case. You will need qualitative analytics to figure out if scrolling below the fold is truly worth it.
Scroll heatmaps may be used to determine if users are scrolling below the fold. A scroll heat map will show you whether your visitors spend the majority of their time at the top, middle, or bottom of the page. As a result, you can add your CTAs to your website and watch the magic unfold.
Keep Track of the Areas Where Visitors are Most Likely to Click
The good thing about heatmaps is that they allow you to pinpoint exactly where visitors are clicking the most. This will assist you in inserting a link within the sweet area where websites receive the most clicks. Once you have done that, you will notice that the number of activities taking place on your site increase, leading to higher conversions and sales.
Recognize why people take certain actions
Heatmaps can help you understand why visitors stay on your site and perform certain actions. Google Analytics does not reveal this crucial piece of information. You can build better websites and boost the number of conversions on your social media sites if you understand why people click on a particular CTA. Businesses use heat mapping for:
- See where your visitors go on your site, what pages they visit, and how much time they spend there.
- Keep an eye on the people’s eye and mouse coordination.
- Keep track of how many times a website or a video has been viewed.
- Look into what is preventing individuals from making a purchase. Recognize their habits, such as where they prefer to click or scroll the most.
- See how clicks are broken down by referral sources like social media.
Keep Track of What your Visitors are Looking For
You may simply track the areas where your target audiences are gazing the most with the aid of eye-tracking technologies. It is always a good idea to use eye-tracking while running an image campaign. The correlation between eye movement and mouse movement has previously been established through research. As a result, you may begin utilizing eye-tracking to determine which aspects of your design are more appealing to your target demographic.
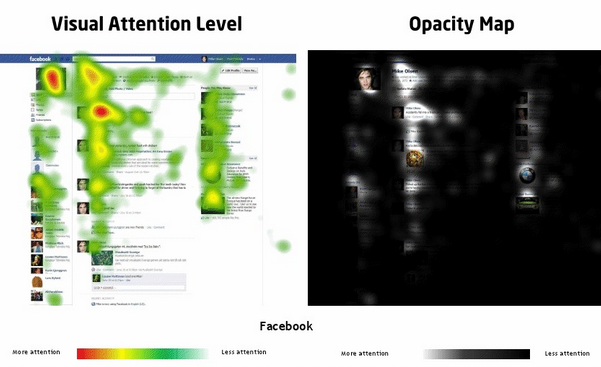
Eye-tracking heatmaps are also able to measure visual attention levels. EyeTrackShop created a study and found that the profile photo and the first two posts on the page receive the most attention, according to Facebook’s heatmap.
 (Source)
The top of the page’s profile information, as well as the list of friends on the side, both have a high ranking. Visual attention begins to wane as you approach the midway point of the page.
Surprisingly, most Facebook users start by glancing at the center of the screen, where they post status updates, before moving to the left panel, which lists friends.
Key Online Marketing Takeaways
The value of profile pictures is not going away anytime soon. People want to interact with real people, so give your social media accounts a face!
The top left parts of the page, where titles, names, and the initial status update are located, also received the most attention on social media networks.
That implies you should use a name that clearly indicates who you are so that you can pass a user’s blink test.
And, while status updates are dynamic, whatever is at the top is plainly essential to visitors, so do not change your profile at random just to keep it fed.
Allow yourself an extra few seconds to consider whether or not this update is intriguing and engaging. If that’s the case, you’ll have a greater chance of getting people to “fixate” on your profile.
Summing Up
In this article, we have listed the features of the most important social media sites for businesses because the most optimal social networking sites for your business are not always the same as the ones you use personally in your everyday life.
We showed you how behavioral and qualitative analytics can come to the rescue when it comes to optimizing your website and social media sites. Understanding customers and boosting engagement, revenue, and conversion rates are key uses of behavioral analytics.
We also talked about how you can use different types of website heatmaps (click map, scroll map, segment map) on your social media sites. In most cases, they will provide you with valuable qualitative information that will allow you to optimize the whole experience on the site.
Main benefits
And showed you exactly what website heatmap analytics is good for, and how you can benefit from the potential of behavioral analytics tools. With the help of qualitative web analytics you are able to:
- locate various areas on any social media website where users spend the most time or do the most activities
- understand why visitors from a specific social media campaign are not converting when it comes to assessing the success of your social media efforts
- optimize your content so that you can create dynamic content tailored to your visitors’ specific demands
- track scrolling habits of your users
- identify the most popular areas on your website, and decide which element should be clickable and what should not, to prevent frustration
- find out why visitors act the way they do, so you can get answers to the whys, thus revealing user behavior.
With the help of the key online marketing takeaways, you can start planning your social media strategy and optimization process. Do not forget, qualitative analytics tools like website heatmaps are always there to perfect your to improve your activity at any stage of the process.