
Emails are most valued for the broadness of outreach they offer and their comparative affordability. With the median ROI of 122%, email marketing promises to be the most economically effective among all digital marketing channels. Nonetheless, reality doesn’t necessarily live up to expectations.
There are many ins and outs when launching an e-mail campaign. Its success is a combination of determinants, including contact list reliability, sender score, content relevancy, sending time, marketers’ team polished skills, and more.
A company should purchase a license for mailing software, produce content and visuals, and pay wages to professionals who handle these all. Email marketing does require funding. So, one has to understand what online mail marketing metrics to calculate – to measure its economical results.
How to measure email marketing success
Before building up data arrays for email metrics calculations, ask yourself about the big idea. Email marketing analytics can serve distinct purposes, and a set of attributable KPIs may differ, as well. Here are a few examples of why a company may want to monitor email campaigns results:
a) Compliant campaigns with legislation and regulations
GDPR, CAN-SPAM Act, Apple’s Mail Privacy Protection, Google Policies – all these make provisions for proper collection, storing, and using of subscribers’ data. They regulate how senders should act when they address recipients via emails – from the contact search moment until the bulk outreach.
If a company fails to comply with relevant regulations, it’ll be blacklisted or banned by mailing systems or Internet Services Providers. Monitoring certain metrics, e.g. delivery or bounce rates, may prevent these threats.
b) Accurate technical performance
A single company may handle several email campaigns running alongside and send out thousands of emails daily.
Think of giant online retailers, like Amazon.com. Although the company uses emails to retarget leads or make them aware of new arrivals, seasonal sales, or personal discounts, a big part of its campaigns are technical emails. In particular, welcome emails, order confirmations, and delivery notifications. Given that around 200 million people visit amazon.com every single month, a company deals with an immense number of email correspondences. The cost of making a mistake is high, and tracking email indicators can help to detect and fix issues timely.
c) Understanding whether it is worth it or not
Although email marketing is cheaper than TV, print, or digital ads and brings high ROIs ($42 for every $1 spent), it’s still an item of expenditure for companies. Software and content for mailings cost a penny, so it’s important to know how many leads and conversions one ultimately gets.
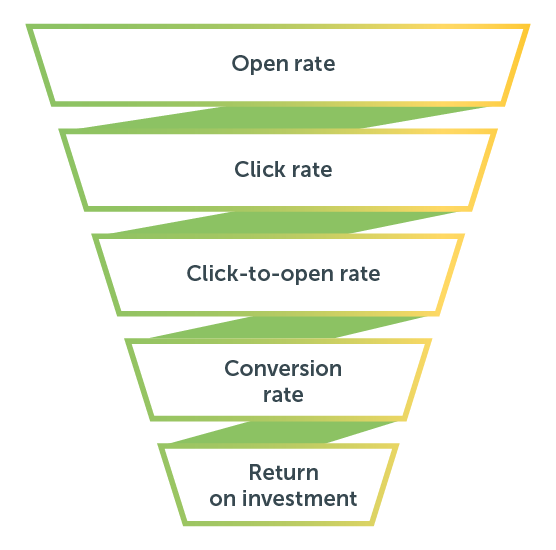
There is a bundle of cost-efficiency metrics, such as CTR or revenue per open, that allows comparing different campaigns and concluding on if they’re worth the effort. Regardless of what particular indicators are, email analytics is a loop of 5 constant stages: monitoring goals, KPIs, metrics, assessment, and improvement.
Set up goals
A set of email campaign performance indicators depends on its goals. Most businesses launch mailings to achieve some of the following objectives:
- strengthen awareness about products or services
To achieve this goal, one should dwell on e-mail delivery and open ratios. Weekly or monthly informational newsletters aren’t aimed to result in conversions. But unless they successfully get to recipients’ inboxes and people open and read them, brand awareness is out of the question.
- generate sales through impulse conversions, upselling, or cross-selling
Email is a great channel to offer customers something related to their previous purchases or remind them to replenish stocks.
To convert clients, prepare compelling subject lines and persuasive CTAs. To audit how effective they were – focus on the engagement time, conversion rate, and revenue per open indicators.
- study an audience
You can use e-mails to collect customer feedback and even run surveys. Emails are good to measure post-purchase satisfaction because you can set up a drip campaign and send out questionnaires instantly after the transaction completion. In this case, relevant metrics to monitor may be open ratio and CTR.
- get referrals
There are 4+ billion registered email accounts in the world, so if you need to launch a referral program – mailings will be just right for that purpose. Share a referral URL among existing leads and include a valuable incentive in the email copy – to encourage recommending your brand. To track how well referral campaigns perform, pay attention to their open and click rates.
Define KPIs
After your defined goals, think of exact email marketing KPIs. If the target is to get more sales, clicks and conversions will be top priority benchmarks. If the prior objective is to make recipients captivated with the content, you may need to focus on engagement time and unsubscription rate.
Track metrics
A goal allows you to direct attention to relevant metrics, rather than tracking as many as possible. You can keep an eye on a set of 3-5, rather than a dozen campaign indicators. As a result, you’ll be able to optimize further campaigns faster and better.
Evaluate
Email campaign success can be measured from 2 viewpoints:
- Technical
Many things can go wrong when you reach out to prospects in bulk. For example, a sender’s IP may be suddenly blacklisted by an ISP. Or – an email HTML may look good on desktop, but turn out to be broken on mobile devices. These petty issues neglect marketing efforts, so before calculating any returns on expenses, make sure the online mail campaign setup is error-free.
- Economical
The number of successfully delivered email copies doesn’t equal the number of conversions you’ll receive, ultimately. An average email open rate among industries is around 22% and a good conversion rate is 2-5%.
Many factors contribute to the ultimate conversion:
- time of the day the email was read
- the aptness of the email subject line, the message, and a CTA
- the level of personalization
- the relevancy of email content, including media and lead magnets, etc.
To see a monetary effect from mailings, you’ll need to evaluate revenue per open, active audience trend, ROI, and some other indicators.
Improve
Ongoing email marketing analysis provides you with insights and allows you to compare performance with competitors or niche benchmarks, see trends, and build forecasts.
If you need to improve email marketing campaigns – here’s a short checklist to start with:
Responsive e-mail design
Around ⅔ of people say they delete e-mails that don’t display correctly on mobile devices – even without reading them. So, taking care of a responsive email layout will pay off.
Responsive techniques prevent bad rendering and adjust e-mail templates to device screens. To create mobile-optimized and eye-catching email content, use big images, include enough white space for convenient scrolling, and highlight buttons with CTAs so that they are tapped easily.
Personalized subject lines
Instead of writing broad-matching subject lines, add details that are relevant for recipients – name, company name, job title, a mention of the previous conversation, etc. This simple tip may increase the open ratio by up to 29%.
Personalization starts with segmenting an email list. Use demographics or information from CRM, or both, to group leads. After, write down more precise subject lines patterns – for every segment.
“Human-to-human” approach
Today, more and more brands send out newsletters on behalf of particular employees, rather than a company as a whole.
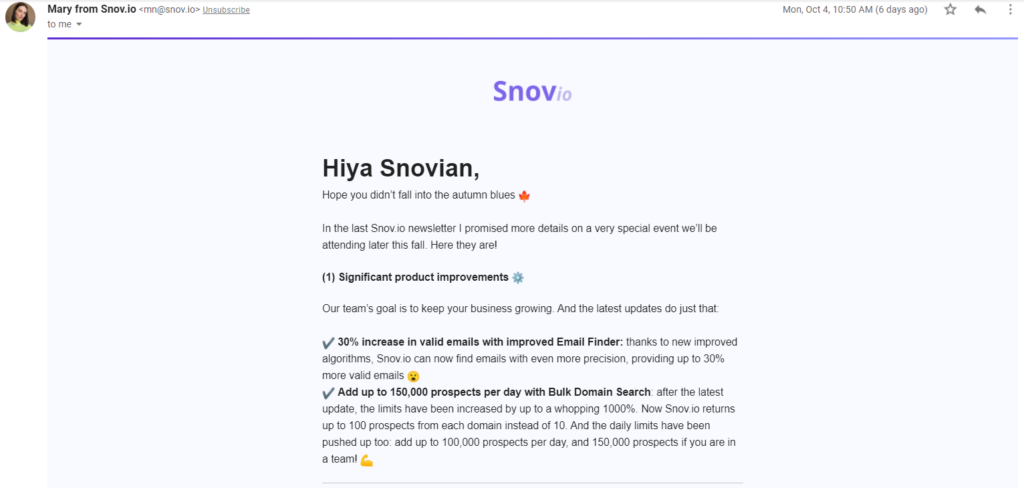
“Personalized “From” fields and email addresses result in higher email open ratio”,
source: a snapshot of Snov.io newsletters
These messages are less bounced, so if you still use a “[email protected]” email address for outreach purposes – replace it with a real person email.
Email length best practices
A subject line should be around 9 words long, and an e-mail copy – between 50-125 words. In general, it’s better to be as short and precise as you can afford while keeping the essence. People send and receive around 120 emails daily and around half of all correspondence is reviewed on small screens. No one has time to deeply examine messages. Expectedly, brief email copies (25-50 words) perform better, on average, than emails containing 500+ words.
A smart way to scale up any improvements is to conduct A\B tests. Prepare 2 copies’ alternatives and send them out to 2 different segments. After, measure up which email has got more opens and clicks.
Email Marketing Metrics
Email audience trend
If you regularly run campaigns, you should manage different audience lists or groups of recipients. For some campaigns, e.g. for welcome emails, you may create new lists from scratch, while for others – copy them from previous campaigns.
In most cases, a company deals with 3 types of audience lists:
- target list – subscribers who should continually receive emails
- test list – subscribers who receive “pilot” copies, e.g. during A\B testing
- exclusion list – contacts who should no longer receive newsletters.
Companies create audience lists upon numerous customer information, including demographics, habits, interests, and lifestyles.
Active audience trend
Subscribers don’t behave identically. Ones may open every single newsletter from you, while others may react to e-mails only once in a while. To categorize recipients on active and inactive, track email engagement metrics.
There’s no single rule for defining “ignorance”, but if recipients don’t react to your emails for 3-6 months, you may start treating them as inactive. But don’t exclude them from the contact database. Instead, try to slightly alter mailing frequency and send out re-engagement messages.
Delivery rate
Delivery differs from email deliverability because it doesn’t take into account whether emails were seen by recipients. Even if the message gets into spam, it is treated as successfully delivered.

Poor email delivery can be caused by:
- invalid contacts in the mailing list
- errors in DNS record settings
- bans by anti-spam firewalls
- sender domain blacklisting.
To increase delivery, perform email validation regularly, avoid spam-trigger words, and complete necessary authentications, including DKIM and SPF.
Hard bounce rate
Emails may be bounced if there are issues at the recipient’s server-side. Although you should strive to lessen the metric, having some bounces is unavoidable. A benchmark is 2% and less.

There are 2 e-mail bounce types – soft and hard. Hard bounce errors are permanent. To prevent worsening your email sender reputation, stop mailing to contacts who return hard bounces.
Soft bounce rate
These errors are caused by temporary technical issues, e.g. when the recipient’s inbox is fully packed or the destination server is down.
They can also occur if a mailing system detects too many incoming messages for the same IP address, sender, or domain.
Open rate
The indicator shows a share of subscribers who have opened e-mails.

Opens show subject lines’ relevancy. They may also indicate whether messages have been delivered to inboxes at the right time.
Total open rate
You can measure opens concerning every distinct e-mail campaign or define a total metric. The latter shows whether your email campaigns perform worse or better than a certain benchmark.
Open rate variation
Email opens percentages vary depending on the campaign, country, industry, and device.
For example, welcome emails have the highest open ratio (50%) among other newsletters. Subscribers from Europe and Oceania open emails more, on average, than recipients who live in North America or Asia.
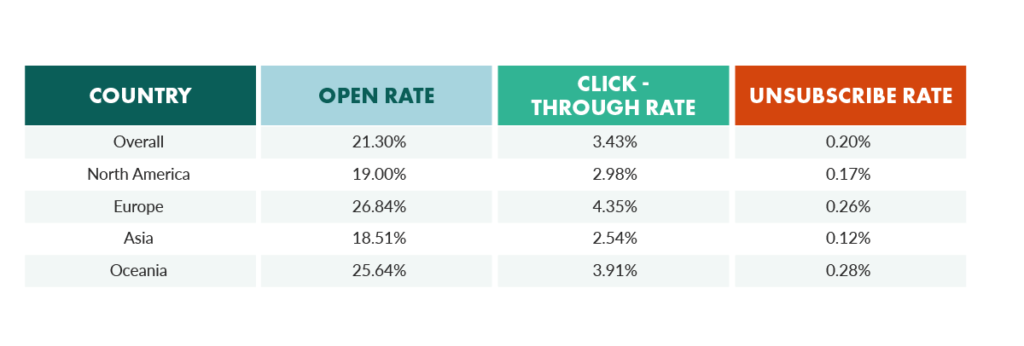
“Email opens by regions”, source
Government-related, hobbies-related, and religion-related emails have the highest open ratio benchmark among other topics (28.8%, 27.7%, and 27.6%, respectively). As to devices, the majority of opens come from mobile devices.
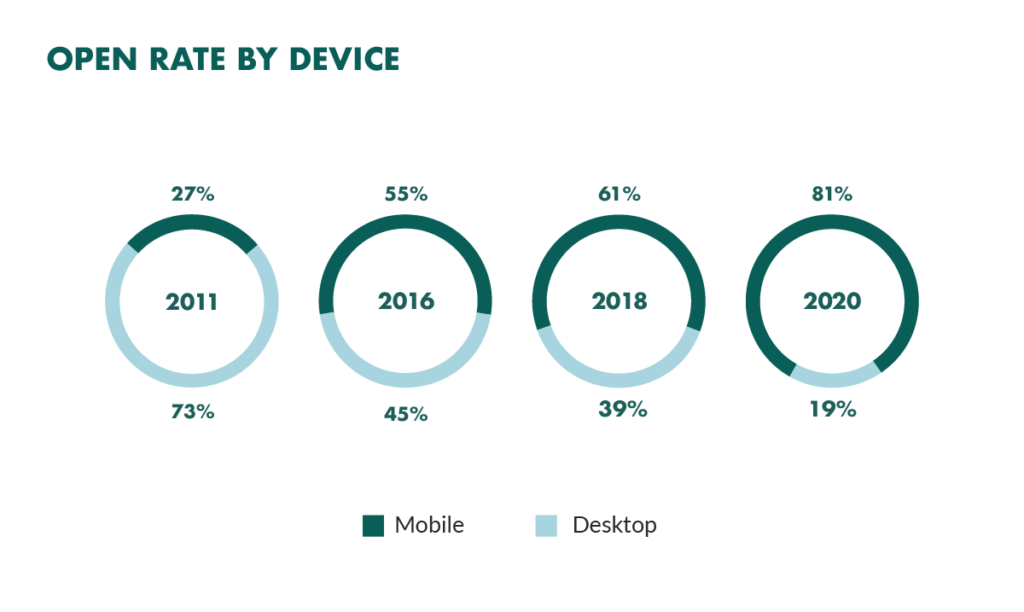
“Changes in emails opens over a decade”, source
Opens per customer
An open ratio can be calculated per every subscriber – in preparation for cohort analysis or A\B testing subject lines.

Engagement time
Automation software will allow you to see the time recipients spend on your emails. You can see how many subscribers read or skim through the content, and what’s the duration of an average interaction.
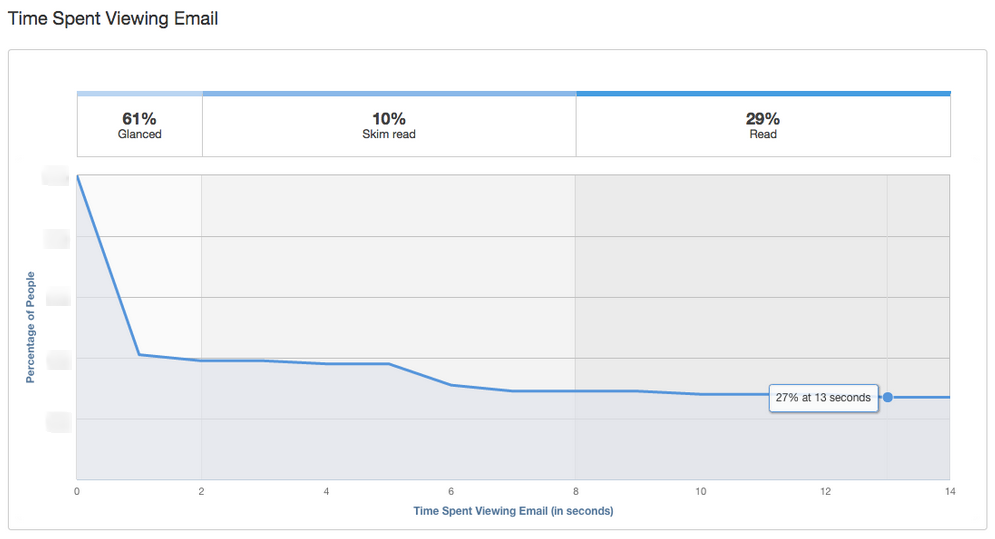
“Time spending chart”, source
Mobile open rate
Most users open and read emails via mobile devices. But you may be surprised by the fact that 90% of mobile opens are made via the Apple iPhone.
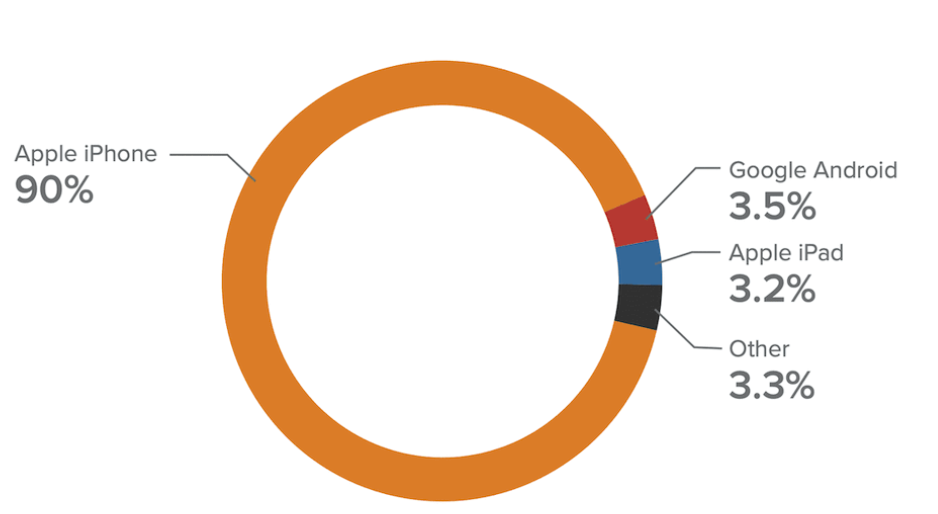
“Popularity of different devices in the mobile email”, source
Time flies, so most people (3 in 5 users, to be precise), say they prefer checking mailboxes on the move. As smartphones become more common than computers, especially among Millenials, designing responsive e-mail copies should no longer be a question for reputable senders.
Click-through rate
CTR shows how many recipients have clicked at least one link in the email they’ve received.

Sometimes, a CTR is calculated with the number of sent emails minus the number of bounces. Also, you can calculate CTR using all link clicks as the numerator in the fraction. Different approaches result in slightly different indicators, so be careful when comparing CTRs without knowing the figures used in the formula.

Click-to-open rate
This metric accompanies CTR as it shows a share of unique clicks in total unique email opens.

The characteristic “unique” is essential here, because a user may open the same e-mail or click on links several times.
Unsubscribe + spam complaint rate per e-mail
An unsubscribe rate is measured per every campaign. It demonstrates how many recipients have opted out of further newsletters after the email campaign has ended.

The same approach may be used to calculate the spam complaint rate. Opt-outs are an inevitable component of email marketing. You can’t diminish them, however, if the ratio exceeds 0.5%, it’s time to re-think the mailing strategy.
Conversion rate
Certain email campaigns are aimed to encourage recipients to complete target actions. And if they do, these actions are considered conversions.

Revenue per open
This indicator is also called Revenue per recipient (RPR). It shows how much revenue an opened e-mail or a particular recipient has brought to a company.

RPR doesn’t take into account delivery errors, so you only consider e-mails that were successfully delivered to leads.
Spam Score
A spam score is a compounded metric calculated by mailing services providers, such as spam filtering hard- and software, like Barracuda or SpamAssassin. Spam scoring includes many checks, including DNS-based checks and content assessment.
Different systems have different scales and recommendations, but typically, a scale from 0 to 10 is used to measure spam. And it’s recommended to keep the score below 3.5 – to pass through spam filters.
Email Client Share
An e-mail client is a program that allows people to manage their mailboxes. They have convenient interfaces, offer extra privacy protection, and allow accessing inboxes from a single control point.
TOP-3 email clients are Apple iPhone (38.9% market share), Gmail (27.2%), and Apple Mail (11.5%). The least popular are Samsung Mail (1.2%), Outlook.com (0.9%), and Outlook Mobile (0.2%).
Email marketing goals & KPIs
Mailing goals are based upon various parameters, such as the type of campaign or the industry. However, there are “good-for-all” benchmarks that one may focus on when assessing e-mail performance results. Below we’ve prepared email KPIs to stick to:
- Delivery rate: 95% or more
- General bounce rate: 0.7% or less
- Open rate: 20% or more
- CTR: 3% or more
- Unsubscribe rate: 0.2-0.5% or less
- Spam score: the less is better, but no more than 3.5.
Analytics is your doorway to launching mailing campaigns that pay off. And it’s not complicated at all if you deploy professional marketers and use proper automation tools. Remember that metrics are just metrics unless you make conclusions and develop further actions upon them. So, after you have e-mail KPIs in place – don’t hesitate to start improving mailings tactics straight away.
5 Comments
Katina B. McLaughlin
2022-09-08 at 10:29Such big and good insights like giving the actionable steps for making Email marketing reasonably helpful.
Thanks for sharing!
Katina
2022-09-12 at 09:53Such a pleasure to went to these sites where I learned a lot regarding Email marketing analytics.
Thanks for sharing an informative article.
RWC
2023-06-10 at 13:56Email marketing reasonably helpful.
Thanks for sharing!
Rwcglobally
2023-06-23 at 07:58Your writing
has been an invaluable resource for me.
Basketballworldcupnews
2023-06-30 at 09:04Thank you for sharing such valuable insights on Email marketing, including actionable steps to make it more effective. Your contributions are greatly appreciated!