Have you ever wondered how much more you can gain from your own website besides your simple knowledge? I tell you the answer: more than you ever think of.
However, website analytics is a very tough topic with many new terms and phrases. On top of this, you have to learn various new tools that you have never heard of before. It is not an easy task if you haven’t got a well-organized, easy-to-understand article that not just throws you all the information, but tries to understand the whole topic with you.
That’s what this article will be all about! Whether you are a good marketer, with beginner analytics knowledge and skills, or an owner of a company that is trying to introduce its products to the online world; you will both find what you are looking for in this article.
You will finally learn how to analyze a website!
Table of Contents
What is website analytics?
Website analysis has two separate tasks. First, it evaluates your website’s performance, in terms of some important aspects which we call “the key metrics”; we will talk about these terms a little later on.
Second, it categorizes the areas you need to improve, in order to have more visitors, purchases, and revenue.
It includes practices like gathering data about conversions, bounce rates, or page views. Have you never heard of these expressions before? Relax, the next chapter will be for you.
What are the key metrics in the website analytics?
Unfortunately, to learn the basics of how to analyze a website, you need to meet with its keywords, and most important terms.
It’s not about memorizing these phrases, on the contrary, it’s about understanding the meaning of them to recognize what analytics software tracks, and what you need to strengthen in order to accomplish your goals.

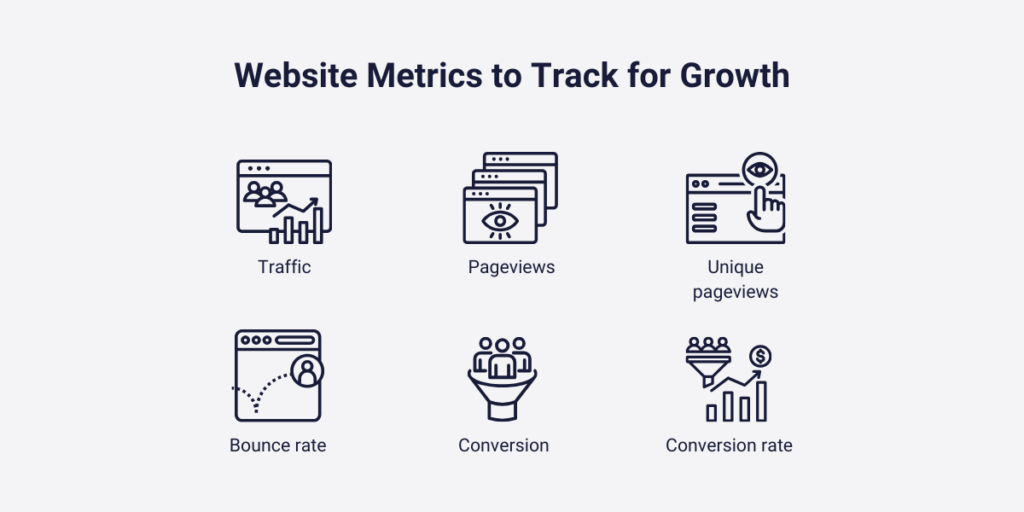
1. Traffic
If you are not completely new to the online space, I am sure you have already heard of this word. Traffic means all of the people who visited your site. This is equal to your overall visitors.
2. Pageviews
Pageviews indicate to you the total number of pages viewed by your visitors. This number is counted when your browser loads the searched page. This means that this number increases when a single user starts to refresh the page over and over again.
3. Unique pageviews
Unique pageviews only add up pageviews from different users. Whether I – as a single user – refresh a page a couple hundred times, it is only counted as one pageview.
4. Bounce rate
Cumulates the percentage of those visitors who leave your site after viewing a specific page. It’s coming from a simple equation: visitors leave your site beforehand / all visitors * 100.
Each of your pages can have different bounce rates, it all depends on that specific page’s attributes (loading time, quality links, nice design, readable font, and many others).
💡 The average bounce rate is about 50-60%. If one of your page’s bounce rates is below 40%, you did a great job, as it is considered really good.
5. Conversion
One of the most important terms out of all of them. Conversion will be important right after you designate your objectives, and try to measure its success.
When a specific visitor accomplishes one of your goals we count it as one conversion. But what can be a goal? Almost everything; filling out a form, buying a product, or clicking a call-to-action button.
6. Conversion rate
Conversion rate tells you the overall ratio of your conversions. Counted with this formula: overall conversion / overall visitors * 100. In general, the excellent conversion rates are between 5% to 2%.
But it is most likely to depend on the actual industry that you are working in. So, don’t be afraid of lower conversion rates, just be informed before you make critical decisions.
Why is it important to analyze your website?
There are a couple of advantages why you must focus on website analytics. This chapter will be all around this topic.
Why are we even analyzing websites? Is it worth it to spend our resources on this area? Let’s see!
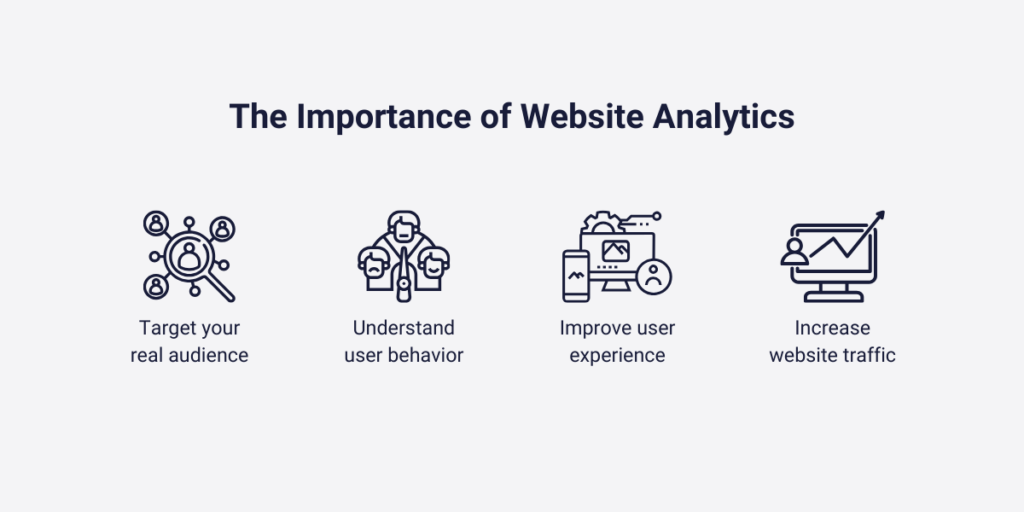
1. Understand user behavior
You create a site, and your visitors use it. But how can you check that everything works in the perfect way?
Find errors in interactive elements of your website
The main issue with website usage is that it is not a one-way route. There are a couple of buttons that the visitors can click on, and after they click there are many clickable interactive elements again in front of their eyes. Can you filter these unlimited possible mistakes by just your own? Not really, but it isn’t a problem, and this is one of the best advantages of analytics tools. Try out Capturly’s JavaScript tracking feature to see what elements are not working on your site!
Analyze both quantitative and qualitative data
These tools can record sessions, in which we can see all of the visitor’s movements on our site from the beginning to the very end. It is completely GDPR and CCPA-compliant (two of the biggest regulations for data protection) to record these sessions, however, there are some rules that you need to have in mind.
From these sessions your analytics tool can generate heatmaps and funnels, where you can categorize where your potential buyers go most of the time, and whether it is in synergy with your goals.
Tailor your website to your users
If you detect errors or bugs, there is not a single thing you must be worried about. You just need to take advantage of your given data and make your site better optimized by just implementing, or updating those things that your customers want.

2. Target your real audience
These tools are not just for a more optimized website, as these programs are more than that. As I already wrote down, there are some legal criteria that ensure that you mustn’t get access to all of your customer’s personal data, but there are a couple of things that you can earn via these tools.
Where your customers are coming from (browser, referral link, etc.), which areas, countries, and cities they live in, what type of device your customers use when they arrive at your website, how much of your traffic comes from first-time visitors, or returning visitors, and etc.
This data will not just help you make your site better-optimized, but marketing campaigns may be built up with the help of this data.
You can determine targeting special types of people into groups, which all have something in common. The same characteristics can be its country, city, browser, or device for example.
3. Improve user experience and increase traffic
It’s just one thing that you get to know your visitors better, but there is another half of this advantage. If your customers are more satisfied with your site than ever before it will lead you to a better user experience.
💡 A study shows that 88% of the potential buyers would never come back to a site, after experiencing a bad user experience. This means, you better take care of it, and luckily these analytics tools will be all around you to help you.
Because your visitors reach certain elements of your site quicker, and notice that they can navigate themself to the decision stage of their buyer’s journey in a more effective way, they will not just use your site more often, but recommend it to their friends and relatives.
But I can provide you with more positive news. Since you will get a more in-depth analysis of your visitors, you can tailor your website to different browsers, or you can create contents based on your visitors’ culture, or their interests.
In the end, it will lead you to increased traffic, and more revenue.
How to analyze your website step-by-step?
In this section of the article, I will show you the main parts of how to analyze a website. But it’s just one part of this section.
On the other hand, I will also introduce you to some analytics tools that will make your life easier. Are you curious yet? Then let’s meet with the steps!

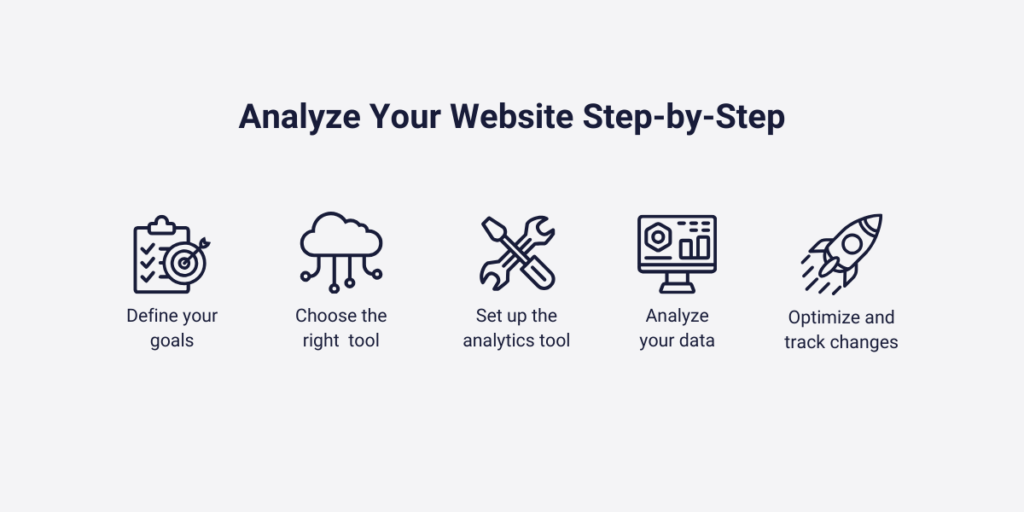
1. Define your goals
This is the first crucial part of this process, as a bad or ineffective goal determination may end up spoiling the whole plan. However, the desired goal can be almost anything.
There are 4 types of goals:
- Revenue goals: These goals will be all around the purchases themselves. Usually important in B2C industries, E-Commerce businesses usually rely on these goals.
- Inquiry goals: It is important to create inquiry goals when your whole objective is all around giving more information to your customers. This goal can be for example a phone number or an email address that the customer needs to reach at the end of their session. It is mostly used in the B2B industry.
- Engagement goals: Engagement goals are created usually to track specific user interactions on your site. Defining these goals will help you determine the number of your potential customers.
- Acquisition goals: These goals help you to earn something that you can use later on. For example, signing up to your page. It can be a goal because even if the customer doesn’t buy anything from you, you still have its email address, or phone number, where you can send marketing messages promoting your business.
Once you determine your goal(s) (since it’s not a problem, if you choose more than one), you can move on to the next phase.
2. Choose the right website analytics tool
After you determine what you want to measure, you still have to decide which analytics service you want to use to analyze your website.
The thing is, most of these tools have the same characteristics, as most of them have heatmap and session recording.
Usually three things separate in these tools’ offers:
- the maximum number of sessions the tool can record
- the price of the tool
- their free packages
The most popular tools are Hotjar, Mouseflow, Fullstory and Smartlook.
But if you want a beginner-friendly tool, we recommend you try Capturly.
Let me introduce you to Capturly:
- Budget-friendly & no need for manual setup
- Session recording and 3 different heatmaps
- Marketing-related features such as email survey and conversion funnel
- Easy-to-use dashboard with JavaScript error tracking
- User frustration tracking to never miss a click again

3. Set up the website analytics tool
After you choose the perfect analytics tool, you only need to insert your tracking code to your website to start work with it. You need to recognize that there are two separate ways you can set up these tools to your site.
Insert the tracking code with WordPress plugin
If you use a WordPress site, plugins are your favorite friends. If you choose the Capturly WordPress Plugin, you just need to download it from the “Plugins” menu here or from your WordPress Dashboard. After a few super simple activation steps, it’s ready to analyze your website.
Insert the tracking code without plugin
If you are not using WordPress, you don’t need to worry about it either. Capturly is compatible with most website building platforms, ranging from Shopify to Wix to BigCommerce. In this case, you need to choose a plan that suits you, sign in on Capturly and insert your tracking code (which is easier than you think). If you need a more detailed description, here is our guide on this topic: https://capturly.com/documentation/capturly-setup/.
4. Analyze the traffic and user behavior
Once the analytics software is set up, all you have to do is follow the data collection process with keen interest.
💡 Pro tip: If your website receives low traffic, try visiting your site and engage by clicking, scrolling, and generating activity. Once you have successfully set up the tool, you should be able to see your own activity in the Session Recording menu.
Can’t see it? Don’t panic! Sometimes, you may have to wait up to one day before data from your site begins to appear, due to aggregation time. Be patient and keep track of your growth!
Check your goals again
It is very important that your analysis should be in synergy with your chosen goals. So, if you want to improve your conversions, you must analyze your page’s conversion rates.
There are at least two separate things you need to analyze in a website. You need to get an answer to the “what” and the “why”.
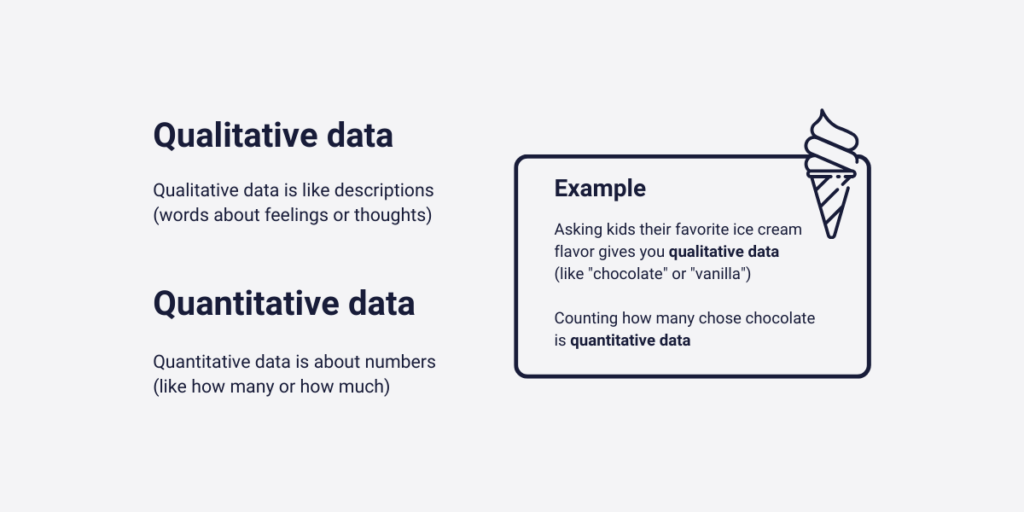
Qualitative data – the “what” type of questions
“what” types of questions are connected to the traffic itself.
- How many people found your website
- How they found your site
- Which web pages are popular amongst your visitors
These kinds of researches usually do not require website analytics tools, as you can get an answer by just using Google Analytics. As TechTarget wrote down: “Google Analytics is a web analytics service that provides statistics and basic analytical tools for search engine optimization and marketing purposes.”
Google Analytics is free for everyone, you only need a Google account to get access to all of its opportunities.
So Google Analytics is a quantitative tool that gives you numeral values to your questions but does not answer the real meaning of these results. As we mentioned, to understand the whole picture, you need a website analytics tool that provides both qualitative and quantitative data. One such tool is Capturly, mentioned above.
Quantitative data – the “why” type of questions
User behavior analysis tries to capture why your visitors do a specific activity on your site. Although some “why”-s can be answered by just using Google Analytics, most of the time it requires another tool. These are called behavior analytics tools which try to show you the real meanings of different user behavioral activities.
Let me share you an example about these two website analysis types and the differences between them:
By just using Google Analytics you realize that your visitors are less likely to reach the payment phase in the last couple of weeks on your site. Alright, but how can we find out the cause of this issue? Of course, a session recording tool will help you out!
After analyzing your heatmaps and visitors’ recent single sessions, you realize that your last update caused a malfunction of a call-to-action button. So those visitors who want to navigate themself to the payment phase with that chosen route are now unable to navigate themself there.

5. Optimize and track changes
And that’s where you need to take action. As it is almost equally important to not just analyze your weak spots, but repair them as soon as possible.
There can be several things you may find a little outdated, or just a little bit odd to your customers. But be aware that you can not solve everything in minutes. Try to focus on the most critical aspects, and solve those issues first. Many of your bugs may only be seen at once, or twice, and never happen again.
Your potential buyers do not demand a perfect site from you, just an optimal one, where they can concentrate on what they want to buy instead of finding the right buttons, or not knowing how to reach the next stage.
If you analyze your website correctly, you will definitely feel its advantages. For a deeper insight into heatmaps, session recordings and conversion funnels, read our related guides:
- Ultimate guide to heatmaps
- Everything you need to know about session recordings
- More about conversion funnel optimization
Conclusion
In this article, I led you to the magnificent world of website analytics. I tried to introduce you to the main keywords and expressions, which are all crucial to understand the basics.
The later stages of the article were all about a step-by-step analysis. If you follow these instructions during your website analysis, I think you can not go wrong at any stage.
However, if you need more information, or you want a more in-depth understanding, I can recommend our other blog articles on this exact topic. You can read more about the best analytics tools, more about heatmaps and session replays, and some other crucial parts of website analytics.

Don't forget, sharing is caring! :)

![How to analyze your website [Beginner guide]](https://capturly.com/blog/wp-content/uploads/2024/01/How-to-analyze-your-website-Beginner-guide.png)
1 Comment
Wordle answer today
2024-01-15 at 09:04I recently discovered your website and find it to be both intriguing and useful. I want to read more of your blogs in the future.