
In the early days of websites, there wasn’t much attention given to website analytics tools when they were first introduced. People didn’t realize their true power right away; it took some time. It wasn’t until the early 2000s that these tools started gaining popularity.
Google, emerging as the dominant search engine, eventually launched Google Analytics, a user-friendly quantitative analytics tool available for free. Since then, however, the emergence of qualitative and quantitative website analytics tools has turned the image of analytics on its head. Dry facts are made more tangible with innovative tools such as website heatmaps.
In this article we will show you a slight slice of these analytics tools products; the different types of heatmap services. On top of that, we not only introduce you to this advantage but show you how this service can be one of your favorite friends, during your online appearance. So, product teams, lift your heads up – this article is here to assist you!
Table of Contents
What heatmaps are good for?
You may know a couple of things about heatmaps, but it’s better to have some words about them, even before we start to get into the main topic of this article.
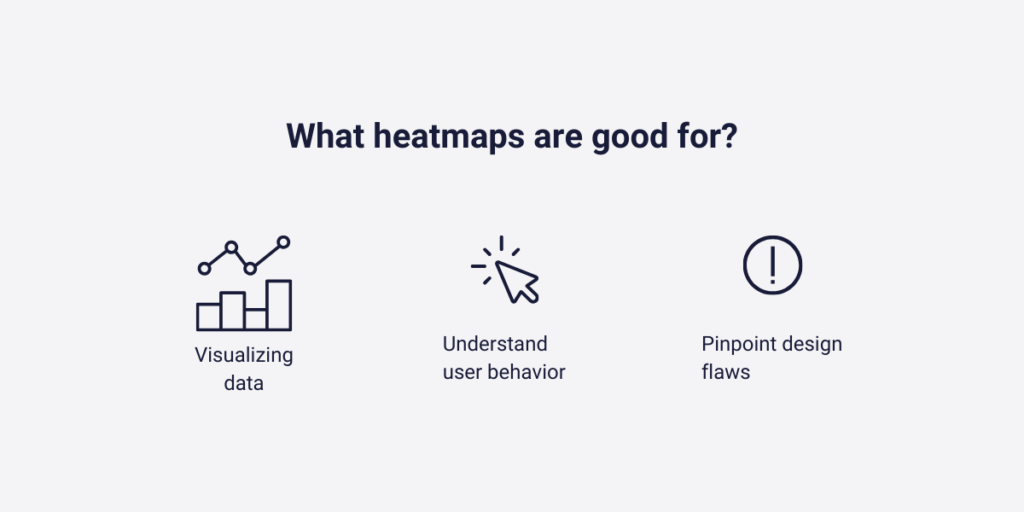
A heatmap is a tool for visualizing data that helps us understand intricate connections, correlations, or trends. Various industries, such as sports, geography, or biology, utilize heatmaps, even though we often don’t discuss them in those contexts.
The past few years have witnessed the popularity surge of website heatmap analytics. During this period, numerous website analytics tools flooded the market, and millions of websites adopted them, noticing increased user satisfaction shortly after the tools were implemented. How are these two things related? The key lies in understanding your visitors. In the online world, it’s challenging to directly ask visitors about their preferences, listen to their complaints, and address their desires.
Heatmaps make this process much more manageable. A website heatmap visually represents how users behave during their site visits, indicating where they click, scroll, and tap. It unveils both weaknesses and strengths. Simply addressing these issues can result in thousands of more satisfied customers and buyers, contributing to your continuous growth. Enhancing user experience is crucial for a website, and heatmap analytics prove to be the most efficient tool for achieving continuous improvement.
When do heatmap analytics are helpful?
As mentioned earlier, there are different heatmap options, and to understand the types of website heatmaps, we need to explore them further. Even though we know that a heatmap is a tool for visualizing data, we can visualize data in different ways and measure various metrics. Using heatmaps becomes helpful when the gathered data is complex, and without a visualization technique, interpreting them would be challenging and time-consuming.
💡 Consider this example: scroll heatmaps aim to show where, and how much your customers scroll their hand, touchpad, or mouse in their visits to your site. Without using heatmaps, you would still have this data with exact coordinates, but deriving meaningful information from this written data would be nearly impossible.
In this chapter, I will introduce three basic types of website heatmaps. The first two are available at all major data analytics companies, while the third is a unique improvement by Capturly. But what is Capturly? Capturly Analytics is one of the most versatile user behavior analytics tools on the market. Our tool can analyze each session, create conversion funnels, and track the customer journey step by step. Moreover, you can create surveys to monitor your visitor’s satisfaction.
Types of website heatmaps
In this section, we will briefly observe the offered heatmaps of Capturly’s individually! Now, let’s meet with them:
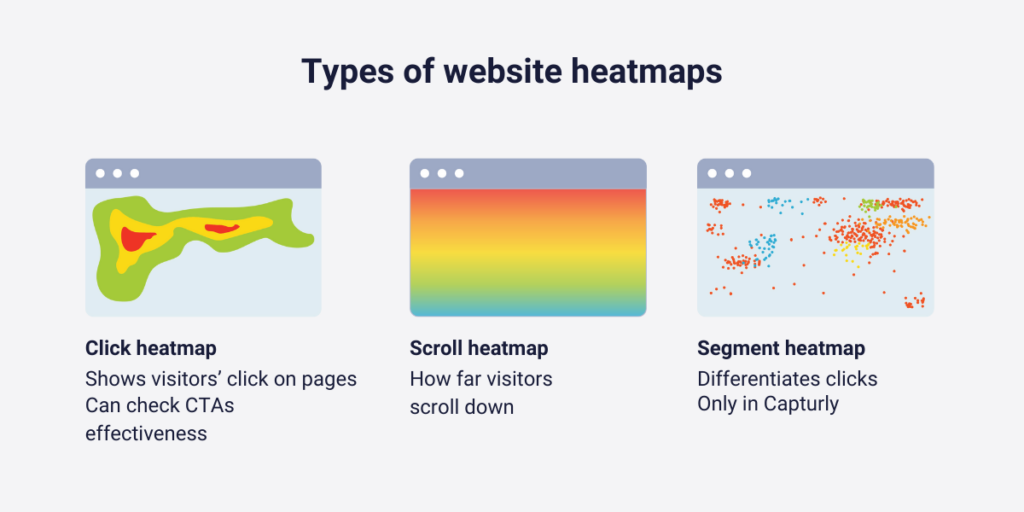
Click heatmap
It shows your visitor’s clicks on your pages. The areas receiving the most clicks (the most active parts of the site) are highlighted in red, while those with the least activity are marked in blue. But these two colors can show up with millions of shades based on the numbers behind them. This type of distinction is displayed on every type of heatmaps, but you better understand the mechanism with the first type. You can use click heatmaps as a simple verification to measure the effectiveness of your call-to-action buttons.
Scroll heatmap
The scroll heatmap shows how far visitors scroll down your pages, indicating engagement levels. It helps identify where visitors lose interest by creating heat zones on your pages. Hotter zones are higher on the page, reflecting the observation that interest tends to decrease as you move down. While this process is unavoidable, adjusting your page layout can slow it down. The scroll heatmap also offers insights; for instance, if visitors rarely reach the bottom, it may indicate they aren’t aware of additional content or a technical issue. It helps optimize your site for different devices, showing the visible pixels without scrolling.
Segment heatmap
The segment heatmap, unique to Capturly Analytics offers personalized adjustments. Unlike the first two, it isn’t part of major analytics packages. This heatmap can visualize differences in clicks based on visitor source, operating system, browser, device, or whether they are new or returning visitors. Beyond that, you can analyze clicks on mobile, tablet, and computer separately to identify effective segments and associated issues.

What are the biggest issues that heatmap analytics can solve for product teams?
Now that you understand the importance of heatmaps, let’s explore how they connect to the daily issues faced by product teams. Product teams often encounter unique challenges distinct from regular web analytics users, and you’re probably wondering if heatmap analytics can provide solutions to these problems. In this chapter, it will be revealed!
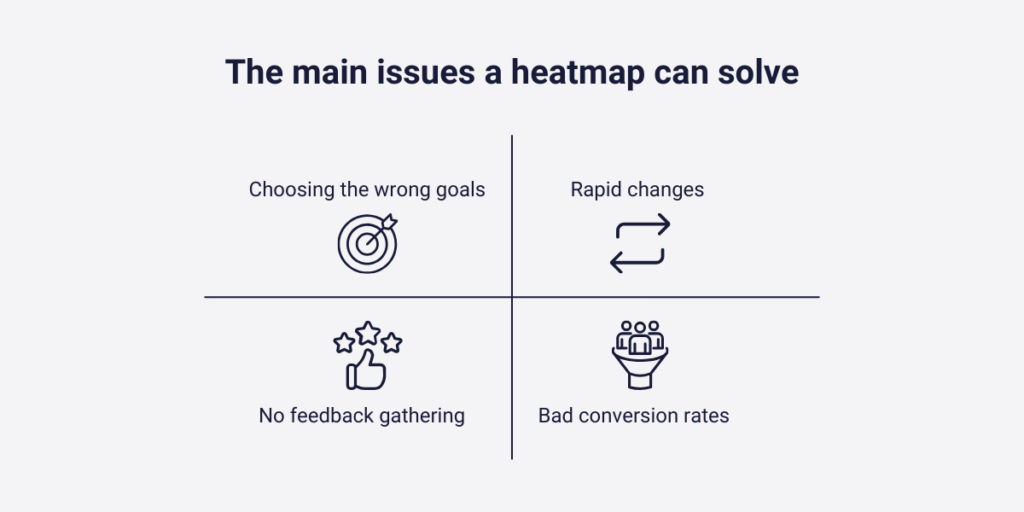
Choosing the wrong goals
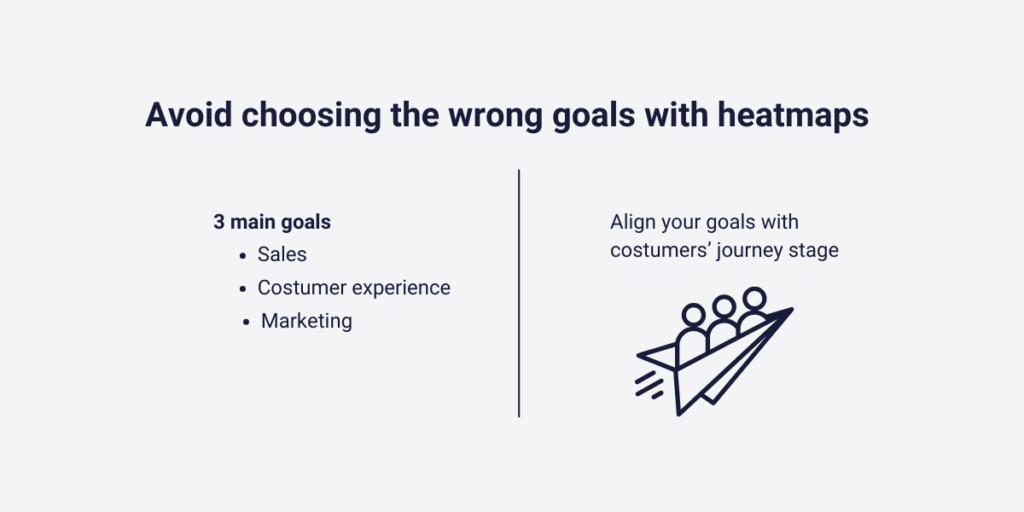
The first issue that a product team may face is determining a wrong goal, or goals at the beginning. There are a couple types of goals which all require a little different approach, just as:
- Sales goals – to reach better sales metrics in the end
- Customer experience goals – to establish a tighter bond with your customers
- Marketing goals – to increase the recognition of your company
And there are many other less popular ones as well. You may know what you really want to achieve in the first place, but is it that aspect you really need to care about?
Determining the right goal isn’t always straightforward.
💡 For instance, you may set sales goals because the company earned less revenue than last year. However, achieving bigger numbers in this metric might depend on improving customer experience. In this case, the first goal stems from the second.
How heatmap analytics can help avoid this:
Analyzing the busiest points on your site using heatmaps can reveal the exact customer lifecycle stage most of your customers are in (reach, acquisition, conversion, retention, loyalty). If most of them click on the “buy now” call-to-action button, they express an immediate urgency to make a purchase.
Conversely, if they click on the FAQ section or other subpages ensuring your website meets their needs, you may not have established a strong connection with potential buyers. So in this case, it isn’t the right choice to add sales-type goals in this case, you need to create a better customer experience first.
No feedback gathering before product creation
I’m pretty sure you have highly qualified colleagues who fairly know what the potential buyers want. But does this mean that you can create a product without doing research on how your customers would react to those new ones? Not at all! Even if most of your co-workers believe they can, they are still not capable of predicting your potential buyer’s reaction. It would be good, but then too many of us would become millionaires. Customer feedback is your potential clients’ satisfied, or dissatisfied comments on your products, services, or generally to the company itself.
Gathering customer feedbacks have so many advantages:
- It can increase the customer experience
- You can make more informed business decisions
- It can help you improve your products or services
- Your customers feel you appreciate their thoughts and comments
How heatmap analytics can help avoid this:
Although these data analytics tools provide you with other features that are likely more capable of gathering more customer feedback (for example, surveys), heatmaps still can provide you with some crucial data.
Since you can analyze clicks and scrolls, you can measure how your customers react when you promote your upcoming products on your website. If most of your customers end up scrolling before meeting with the specifics of your newly promoted product, they don’t really care at all.
On the other hand, if you observe an increased number of clicks on those CTA-s that are connected to the new products, and most of your visitors scroll down the whole page to understand its basics and working mechanism, you can be calmer about the later positive outcome.
Rapid changes in trends, customer expectations, and technology
- Did you ever think that by 2022, over 60% of the world’s population will use social media?
- Did you ever believe that by 2023, people will no longer be afraid of speaking with robots to solve a problem?
- And in recent years, have you noticed that customers want social engagement from their favorite brands?
It’s hard to believe, but these are all truths.
Why is that? Because these aspects change drastically from time to time. And if you are not aware of these changes, your product will no longer satisfy your customer’s needs. And even if you sell a solution to a problem for the cheapest price, it won’t save your business plan. Is it something you can prepare for? Well, completely not, but heatmaps can help you a little.
How heatmap analytics can help avoid this:
One of the best features of heatmaps is that this tool’s results give you a glance at how your visitors like your site. Briefly, heatmap analytics help your company to measure your website performance, including how well you understand your users. You can gain information from your user’s clicking patterns, the optimal length of your blog articles, sentences, or words, or what your visitors hover with their mouse while they read.
These all tell you some information about how effective your website is, how engaging it is to your customers, and whether they are still interested in your brand at all. If you notice that your website performance is worse than it was, you can make more informed decisions with your data analytics tool, including its heatmap analytics. This can certainly prevent you from reaching the worst scenario when you lose all of your customers because your site is outdated.
Worse and worse conversion rates
This issue is usually connected to the last three mentioned issues, but we must have some words on it individually. Conversion rate is one of the most important metrics of website data analytics. This metric tells you how many percent of your visitors do a desired action at your site.
A desired action is an objective that you defined as a goal in the early stages. There are several types of goals, including:
- Revenue types of goals
- Inquiry types of goals
- Engagement types of goals
- Acquisition types of goals
So if your goal is to convince your buyers to purchase one of your products on your site, a successfully achieved conversion is when the actual customer really ends up putting one of your products into their purchase cart and reaches the transaction stage.
The effective conversion rate varies among industries and factors, but it’s helpful to compare with competitors and track your company’s rate over time. If you notice a consistent decrease, it’s a signal that you need to take action. You may define wrong goals, the trends are changed, or you have not gathered enough feedback, but one thing is sure: you need to figure it out as soon as possible.
That’s what heatmap can provide to you. Fast and effective graphical representation of your data which helps you to get access to your customer’s minds, and understand what they want from you to fix in order to get a perfect website experience.

Conclusion
As you may already have realized, heatmap analytics can make product teams’ tasks easier. These tools can really take the pressure off you.
In this article, you learned the definition and the three most important types of heatmaps that you can meet with. After that, we mentioned those issues that heatmap can help you fix if you use this tool in the right manner. Following that, we discussed the issues that heatmaps can help address if used correctly. Whether you’ve set the wrong goals, lack customer feedback, or struggle to keep up with rapidly changing trends, heatmaps offer solutions. As a product team, there are often risks, and seizing the chance to keep your business thriving is crucial.
Using heatmaps isn’t just convenient; many data analytics companies offer them for free. And remember, making more informed decisions is a key aspect of a successful online journey. The better-informed you are, the more enjoyable your customers’ experience will be on your website.