Starting to learn about web analytics might feel a bit like entering a maze of confusing words and tools. One interesting term you’ve probably come across is the “segment heatmap.” Don’t worry; we’re here to explain this cool concept in simple terms and show you how it can make a big difference in making your website better.
Whether you own a website, do marketing, or just hang out online, it’s important to understand how people use your website. The more we know about what visitors do on our sites, the better we can make things for them. And here’s where heatmaps come in—they’re like colorful maps that show us how people move around and do stuff on our websites.
Table of Contents
Website Heatmap vs. Segment Heatmap
Now, let’s delve deeper into the distinctions between the website heatmap and its more specialized counterpart, the segment heatmap.
What are website heatmaps?
Imagine you have a special pass that lets you see how your website is doing—a quick, easy picture that shows you where people are most interested. That’s exactly what a website heatmap does. It’s like a smart tool that uses colors to show how people interact with your site, like where they click, scroll, and pay the most attention. Think of it as a digital X-ray, showing you the paths users take, what grabs their attention, and where they spend more time.
This website heatmap gives you a super helpful overview of how people act on your site at a glance. It’s like a map guiding you to make your website better. With this information, you can make smart choices about how your website looks and what’s on it to make sure people have a great time using it.
What is a segment heatmap?
Now, let’s make that backstage pass even cooler with something called a segment heatmap. Think of it like going from regular access to a VIP pass. The segment heatmap lets us focus on specific groups of people, giving us a closer look at how they use a website.
If the website heatmap is like looking at everything from a distance, the segment heatmap is more like using a microscope. It helps us break down big sets of information into smaller, more specific details. This way, we can see how different groups of people, like those from specific places or with certain interests, use the website.
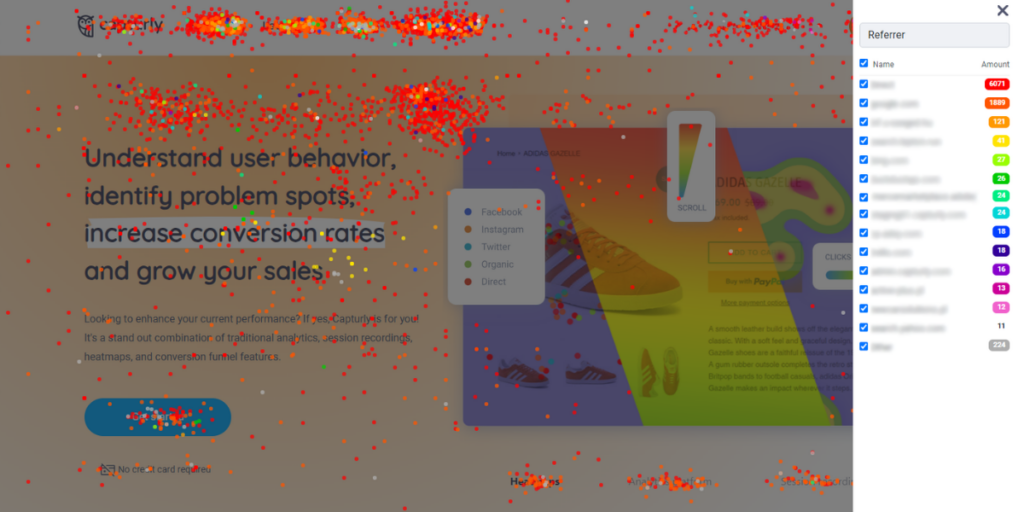
For example, imagine you have a shop online. The website heatmap might show which product pages are popular overall, but the segment heatmap can tell you which groups of people, like those from a certain area or age group, are the most interested. It’s like having a super precise tool that turns messy information into useful ideas, helping us make smart decisions.
So, while the website heatmap gives us a big picture, the segment heatmap zooms in on specific details. Together, they help us create really smart plans to make websites better. As we keep reading, we’ll find out even more cool things about segment heatmaps and how they help us understand what people do online. Stay tuned for more interesting stuff!
The Power of Segment Heatmap
Now, let’s delve deeper into the individual elements of the power-packed capabilities of segment heatmaps:
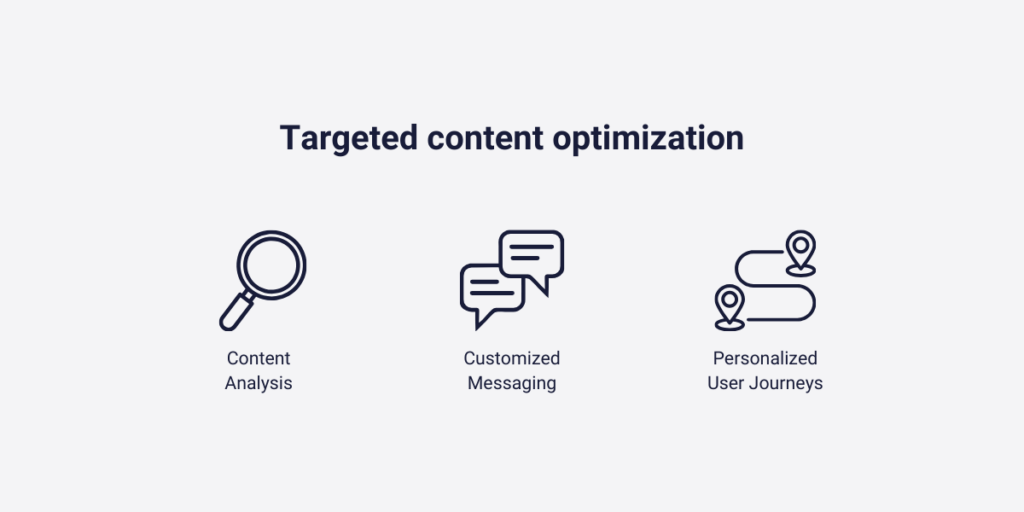
1. Targeted content optimization
Ever wished you had a magical wand to make your website content perfect for everyone? Well, with segment heatmaps, consider that wish granted. This cool tool helps you understand exactly how different groups of people like to use your website. Whether it’s blog posts, product pages, or cool videos, segment heatmaps help you make your website content just right for everyone.
How to do it:
- Content analysis: Use segment heatmaps to find out what content people in different groups like the most.
- Customized messaging: Change how you talk to people on your website to match what each group likes.
- Personalized user journeys: Make special paths for each group based on what they like on your website.
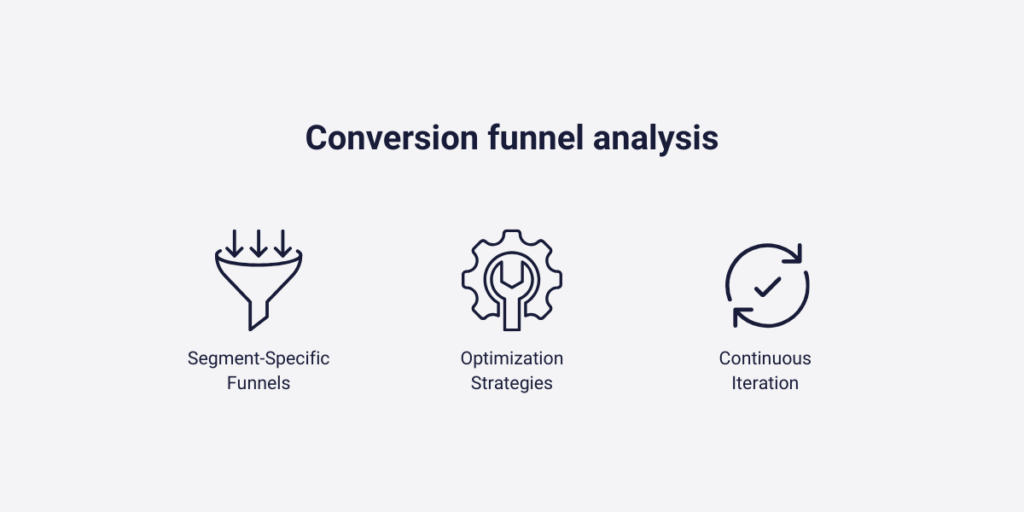
2. Conversion funnel analysis
The conversion funnel is like the heartbeat of your website—it’s what makes it successful. With segment heatmaps, you get the power to look closely at how people go through this important journey. Find out where people from different groups stop or buy things in the funnel. This information is like finding gold—it helps you make smart changes and turn possible problems into wins.
How to do it:
- Segment-specific funnels: Break down the conversion funnel into parts for each group to find where they have problems.
- Optimization strategies: Make changes in the funnel based on how each group behaves.
- Continuous iteration: Keep looking at the data and making changes as people’s behaviors in different groups change over time.
3. Device-centric insights
In a world where people use different devices, like phones and computers, knowing what they like is super important. Segment heatmaps help us understand how different groups of people use these devices. Whether they love their phones or are big fans of computers, this insight helps us make sure everyone has a great experience on our website.
How to do it:
- Device-specific analysis: Look at how different groups use our website on phones, computers, and other gadgets.
- Responsive design refinement: Make our website work better on each device based on what different groups like.
- Cross-device personalization: Add special things on our website for each group based on the devices they prefer.
4. Geographical understanding
As our website becomes popular worldwide, it’s important to think about what people in different places like. Segment heatmaps help us see how people from different locations use our website. This helps us make smart decisions so that our website works well and is liked by people everywhere.
How to do it:
- Location-based insights: Check how people from different places move around our website using segment heatmaps.
- Localized content strategies: Make our website’s content and ads special for people in different regions.
- Global user experience optimization: Make sure people all around the world have a website experience that they love and understand.
5. Demographic refinement
Our audience is made up of all kinds of people, and not everyone likes the same things. Segment heatmaps help us understand how people from different groups, like ages, genders, or income levels, use our website. With this information, we can make our website work better for each group, giving them a personalized experience.
How to do it:
- Demographic-specific analysis: Use segment heatmaps to see how different groups like using our website.
- Tailored marketing campaigns: Make special ads and messages that each group will like.
- Personalized product recommendations: Show different products to people based on what each group likes to buy.
As we learn more about each of these cool things, we see that segment heatmaps aren’t just for looking at data—they’re like a guide to help us make our website better for everyone. Stick around to find out even more ways to make our website awesome with segment heatmaps!
How to Use Segment Heatmap
Here’s a step-by-step guide to ensure you harness the full potential of this powerful analytical tool:
1. Define your segments
The first step in using segment heatmaps is like making a list of groups you want to look at. These groups can be people of certain ages, from specific places, or those who like using certain devices on your website. To do this, think about your big goals for your business and pick the groups of users you want to understand. And remember, it’s okay to change your list as your business grows.
Tips for doing it:
- Strategic alignment: Make sure your groups fit with your big business goals.
- Relevance: Choose groups that matter for the information you want.
- Flexibility: Be ready to add or change groups as your business gets bigger.
2. Select metrics
After making your list of groups, it’s time to pick the things you want to measure. It’s a bit like choosing the right camera lens to take good pictures. You can look at how many times people click, how far they scroll, or how long they stay on your website. Each thing you pick gives you a different view of how the groups are using your website.
Tips for doing it:
- Objective alignment: Make sure the things you measure fit with your big goals.
- Comprehensive insights: Look at a few different things to understand what’s happening.
- Segment-specific metrics: Pick things to measure that make sense for each group.
3. Analyze patterns
Now that you have your groups and things to measure, it’s time to look at the heatmap. It’s like a colorful map that shows where people are most interested, where they get bored, and where things are a bit weird. This helps you make smart choices for your website.
Tips for doing it:
- Visual exploration: Take a good look at the colorful map for each group.
- Comparative analysis: Compare the maps for different groups to find interesting stuff.
- Segment-specific anomalies: Look for strange things that only happen in each group.
4. Iterate and improve
Okay, so you’ve learned a lot from looking at those colorful maps called segment heatmaps. But here’s the cool part—it’s not just about looking; it’s about making things better all the time. Use what you find to make changes on your website, and keep trying new things to see what works best. This way, your website can get even better as people start liking different things.
Tips for doing it:
- Data-driven decisions: Make changes based on real information, not just guesses.
- A/B testing: Try out changes slowly and see if they make a big difference.
- Regular review: Keep looking at the information regularly and make your website even cooler based on what people like.
Meet Capturly: Your Segment Heatmap Ally
Now that you know a lot about segment heatmaps, let’s introduce a helpful friend—Capturly. Think of Capturly as a super useful tool that makes understanding your website even easier and more fun. Here’s why Capturly is like having a cool sidekick for your website adventures:
User-friendly interface
Navigating through complicated stuff should be simple. Capturly has a very easy way of showing you the colorful maps, making it easy for anyone to understand.
Powerful features
Capturly doesn’t just look at the surface—it goes deep. It has lots of cool features that help you understand how people use your website in lots of detail.
Segmented analytics
Capturly is like a specialist in looking at specific groups of people. It helps you see how different groups use your website, finding interesting things that you might miss if you look at everything together.
Actionable insights
Let’s talk about something cool—making the information we find do something. Capturly helps turn all those colorful maps into real plans that make your website better. It’s like having a guide that helps you make smart choices to make your website awesome.
How to use Capturly?
- Sign up: Go to Capturly’s website and make an account. It’s super easy to do, so you can start looking at cool stuff on your website right away.
- Connect Capturly to your website: Follow the simple steps to link Capturly with your website. Don’t worry, it works with different types of websites, so it should fit with whatever your website is like.
- Pick your groups: Now that you’re all set up, choose the groups of people you want to look at. Capturly lets you do this in a way that matches exactly what you want to know.
- Explore colorful maps: Capturly has more than just maps; it has other cool things too, like videos of how people use your website and a special look at where people buy things. This way, you get a full picture of how people are using your website.
Capturly isn’t just a tool; it’s like a helpful friend on your journey to making your website even better.
Conclusion
In the big world of figuring out how people use websites, it’s not just about looking; it’s about always trying to make things better. With the insights from colorful maps and other cool things Capturly shows us, we can be confident as we explore this digital world. Remember, people online do different things all the time, so it’s good to keep learning, trying new things, and letting Capturly guide us to a website that not only gets attention but keeps people interested. Happy exploring!
1 Comment
Fnaf
2024-03-13 at 10:49Your essay is both highly informative and entertaining. I have been waiting for that type of post.