Tep is an adorable fitness tracking app working like a Tamagotchi. We have conducted a short interview with their CEO about how they use Capturly for the optimization of their website.
For those of you who are too busy to read the whole article, we have made a little summary of the numbers in connection with Tep, before and after their optimization process with Capturly.
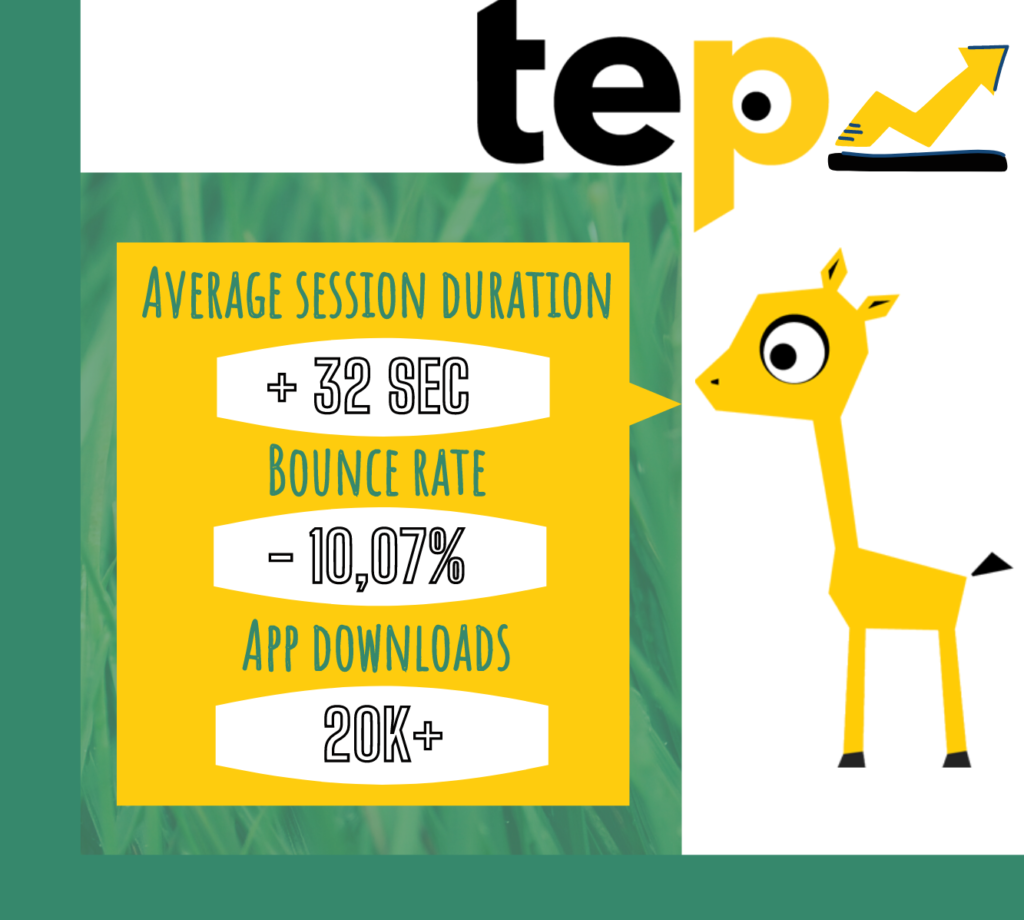
Table of Contents
How did Capturly help you and your startup?
Without Capturly, we wouldn’t have been able to implement those changes that satisfy the needs of our users. Capturly has helped us to improve our metrics easily and effectively. We own a huge thank you to you, guys! — Akos, CEO of Tep
In your opinion, what was the biggest problem you have encountered with your website?
Well, that is a hard question, because we have made some improvements which are equally crucial, but I can tell you the biggest one.
At that time we had adequate traffic coming to our website, but for some reason, they didn’t reach the next step of our conversion funnel, which is obviously downloading the app.
Fortunately (after taking a look at just a few of the recordings), the visitor playback feature of Capturly made the problem crystal clear. Our visitors were very impatient; they did not even wait until the website completely loaded. It only took minutes to implement a splash page and it resulted in a 10.07% decrease in our bounce rate! Since then, we are continuously monitoring our page load time with the Capturly Dashboard feature.
What is your favorite Capturly feature?
Definitely the heatmaps.
The ultimate conversion goal for us is to increase our downloads, so we have to put the emphasis on the CTAs. The heatmaps of Capturly have been a huge help in optimizing them.
With Capturly, we have access to three different types of heatmaps: click heatmap, segment heatmap, and scroll heatmap.
Heatmaps are represented by colors. These tell us more about user engagement, and each type of heatmap has different measurements when it comes to colors. Warm-toned colors indicate a stronger engagement from users, while the cold toned colors tell us the “weak” parts of our website.
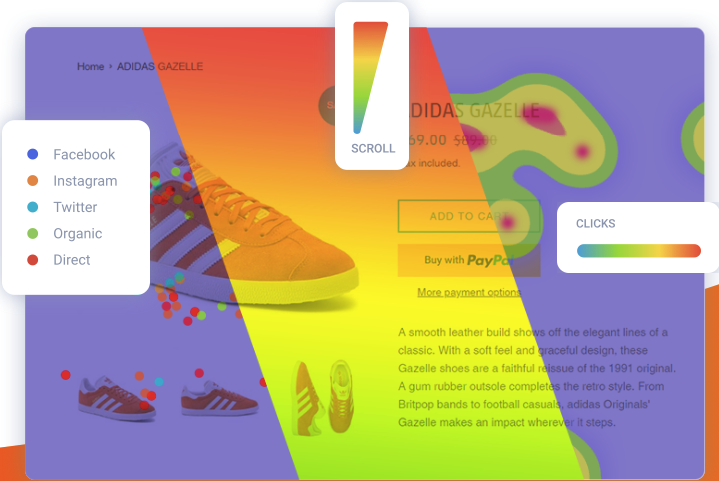
Click heatmap

Capturly summarized the decision-making process of our users. This type of website heatmap shows the exact link position so we got a clear idea of what should and shouldn’t be clickable on our website. With click heatmaps, we made our user experience a lot smoother. And revealed what motivates our users. It also helped us recognize which elements on our homepage are the most popular and most clicked. The animated little giraffe at the top was one of them even though it is a non-clickable element which caused some frustration.
Segment heatmap
Segment heatmaps are the best to get an idea of which referral brings the most active users to our website. Traffic sources can be browsers, operating systems, physical devices, or websites. It is always interesting to see how each segment behaving differently. The segments have different colors which make it easy to distinguish and analyze. It will be helpful anytime we make changes in design or navigation to see how visitors arriving from different browsers or devices react to the modifications. This way we can avoid any problems and frustration from both sides.
Scroll heatmap
The scroll heatmap showed us how far our visitors scrolled down on our website. It made us realize that people didn’t care enough to scroll down to the section where we had the OS-specific CTAs. Less than 25% of the users reached that point. That is a huge loss, we want every potential user to see it, so they can continue their journey of becoming one of our users flawlessly.
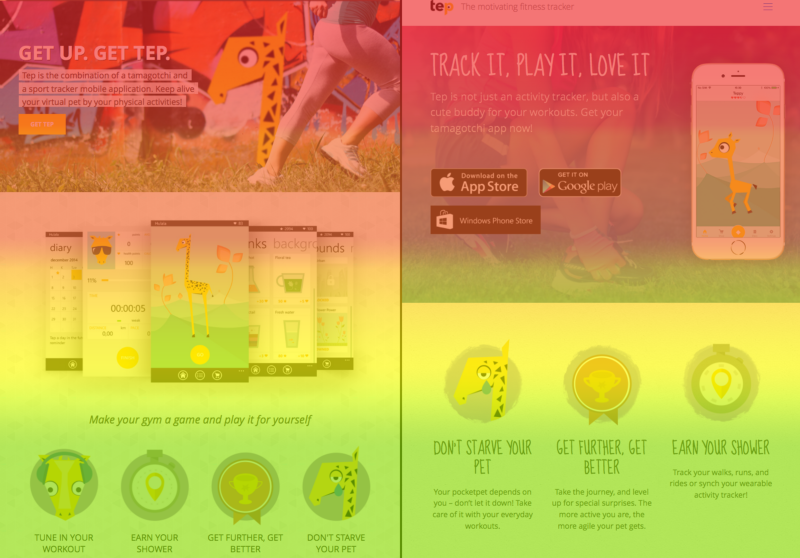
That’s why we’ve decided to place 3 CTAs in the header section. This way it is always above the fold, so every single visitor of our website can see it. This little hack increased our downloads by an incredible 20k. Crazy, right? For just $40, our conversion rates rocketed like never before.
It also made us realize that we need to create more engaging content so that our visitors are more interested in scrolling further.

Were there any problems which really surprised you?
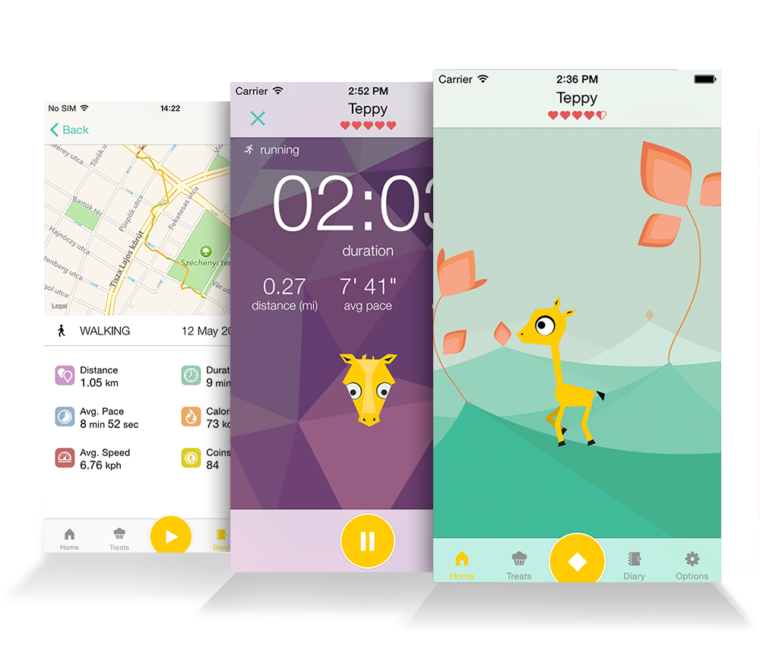
Of course. There are problems that can be unraveled by examining only statistical data. But some of the problems are not like that. We had a surprising observation in connection with the screenshots. The click heatmap revealed that many of the users wanted to see more. They clicked on the pictures because they might have thought it would zoom in or open up a gallery etc. The truth is that none of them were there.
Our users wanted motion, wanted action, so we gave it to them. Now our little giraffe appears next to the CTAs in the header, so they can see the app working without having to do anything. They do not need to scroll or click on the pictures.
Those heatmaps solved problems we would not even think about in the first place. I have to say that the ROI of Capturly is huge, people would be foolish not to choose Capturly for their websites.
Conclusion
Having the success story of Tep, we can all agree that those minor alternations lead to a huge improvement. Even implementing these small changes resulted
- 32-second growth in average website duration,
- 10,07 percent decrease in bounce rate,
- plus a 20 thousand increase in app downloads.
And it is not everything. Heatmaps have a lot more potential. Click heatmaps are very effective at revealing the broken links. They can also be very useful at identifying which buttons are receiving enough attention from users, and which ones should be developed. Heatmaps are able to answer if your site’s navigation system works effectively enough. Bug recognition and eradication of them is as simple as it has never been before.
Traditional web analytics like the number of visitors and bounce rates are important. However, without qualitative web analytics, they might not have realized these problems and their underlying causes.
Do you want to achieve success too? Use the full potential of your website!