A heatmap software is one of the most important website analytics tools you need to get if your goal is conversion rate optimization. Such a tool can be used in many different ways, all for the long-term growth of your online business.
Heatmap tools come with a range of features and we are going to explain all of them in our comprehensive guide. Once you get to the end, it will be crystal clear to you how to understand your target audience and ensure high conversion rates.
Without further ado, let’s find out together why exactly you need to get a heatmap tool right away!
Table of Contents
Why is it Called a Heatmap Tool?
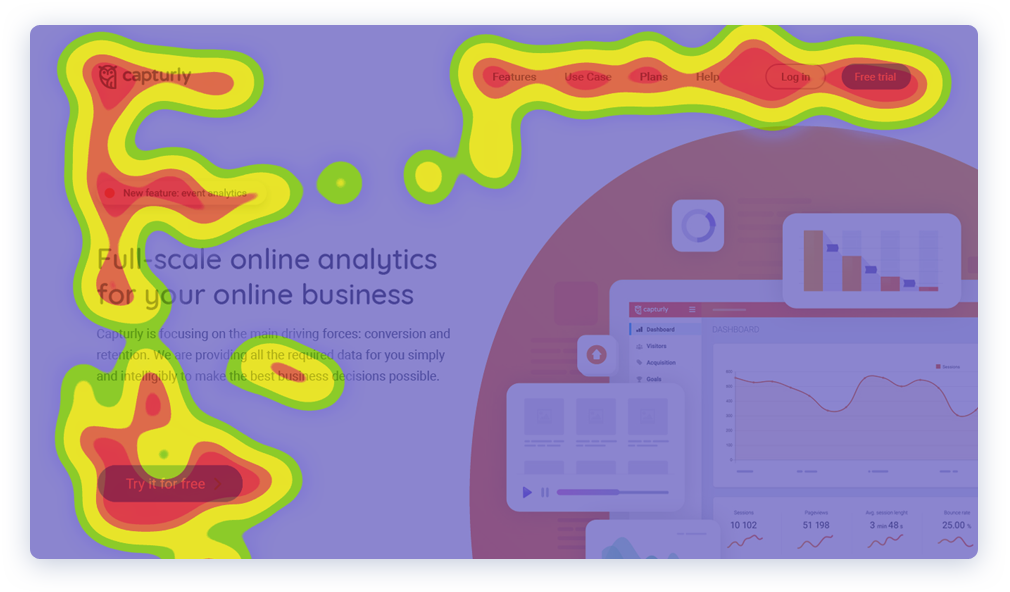
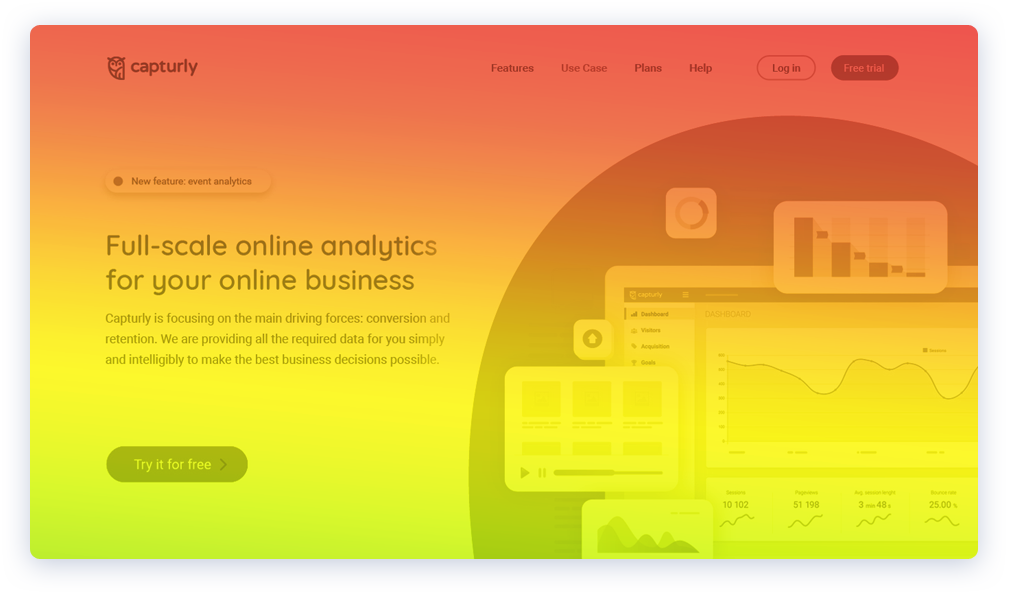
When you hear the word heatmap, you might already suspect that the whole thing is about some kind of visual representation. You are right! Heatmap tools are used to generate visual representations of user activity on each of your web pages.
The idea of collecting data and representing it in a visual form was the idea of Cormac Kinney, who developed this method in the mid-’90s. In the beginning, it was an analytical tool. Traders used, as they wanted to find an effective way to beat financial markets.
When it comes to website analytics, heatmaps allow you to collect information about all the relevant actions that users do on your site. These include hovering their cursor on the different elements of your page, scrolling, and clicking. There are also eye-tracking heatmaps that allow you to track the eye movement of users.
Based on these actions, you can generate the following heatmaps:
- Click maps
- Mouse movement maps or Hover maps
- Scroll maps
- Attention maps
- Eye-tracking heatmaps
Of course, the more traffic you have, the more data you are able to collect. With more data, you can get a more accurate representation of what people generally do on your website. Since many people use smartphones, you need to collect data for different devices as well.
Heatmaps are not worth using at the beginning when you barely have any traffic. Below, we are going to explain why you should use each type of heat map.
Click Maps
Do your visitors click where you want them to? Click maps can help you find it out by capturing the position of every single click that happens on your web page. When you have collected enough data with your heatmap tool, you will have a clear idea of which elements drag the most attention.
Of course, the same type of heatmap is available for other devices as well, except that those are called touch heatmaps. Click maps work for the entirety of your page, which makes you able to see when users are trying to click objects that are not clickable.
This is important because sometimes people try to click images or text that they expect to be clickable. If a heatmap indicates that this is the case, then you have two options. You can either redesign the object to not seem clickable or just add a link to it so that people can finally click it.
Click maps allow you to strategically place your CTAs where users are most likely to click them. Depending on your website, you might want to add some video content along with your CTA button or form. With the combination of A/B testing and click maps, you can find out whether that’s a good idea or the video is just distracting your visitors.
This type of heat map can also help you identify and remove any element that distracts the user. Visitors can also be segmented, as you can collect data about new visitors and returning ones separately. This way, you can find out whether your returning visitors like your redesigned website compared to newcomers.
Hover Maps
Hover maps track mouse movement, thus highlighting areas where your visitors hover their mouse most of the time. People often call these mouse-tracking maps. The only problem with this type of heatmap is that cursor movement is not directly correlated with the object the user is looking at at the moment.
To understand this a bit better, we need to take a look at the research. There was a paper published by Kerry Roden. This showed that 64% of users are actually looking at the area where they hover their cursor. There was another research conducted by Dr. Anne Aula who is a researcher at Google.
According to her findings, 90% of users tend to park their cursor on the side or on a clickable spot. This mainly happens when people are busy reading the contents of the page. In any case, you can use hover maps to your advantage by identifying the spots people keep their cursor on the most and putting important objects there.
These include your main CTA, important advertisements, or content of particular importance. If you want to get the most out of hover maps, you need to use them in combination with other heatmaps or website analytics tools.
Sometimes visitors hover over elements or content because they find it interesting. Other times, they are confused and find it hard to understand what’s in front of them. As you start experimenting with hover maps, you will slowly be able to distinguish between different movement patterns and understand what happened more precisely.
Scroll Maps
A scroll map gives you a precise representation of how users tend to scroll on each of your web pages. By analyzing their scrolling behaviors, you can find out how much they care about your content. Discover the scroll depth of every one of your web pages and reveal how far down your visitors are willing to scroll.
The sections where users spend the most time in are the ones where the money lies at. Now, if you tend to post longer web pages, then the number of users scrolling to the end is not going to be too high. With a scroll heatmap, you can start thinking about where to place your most important CTA, advertisement, or piece of content.
Even though you might have discovered a great tactic of how to design your CTAs, your users are still probably not going to click it if it is too far down the page. CTAs need to be placed in a way so that users have a higher chance of seeing them. Somewhere near the top of the page.
You can also put your CTA below the fold, but this way, the conversion rate of your web page is most likely going to be lower. With scroll maps, you can identify how much space you can work with when it comes to the most important elements of the page.
Attention Heatmaps
An attention heatmap is basically an AI-generated visual representation that is based on an algorithm. What the software algorithm does is it collect attention data for users and creates a predictive eye-tracking heatmap based on its findings.
Since eye tracking as we know it has its own downsides, entrepreneurs needed a better alternative. This is where AI entered the picture, as an increasing number of innovations are available in the field for the wide public. Instead of tracking people’s eyesight, it predicts which elements of your website are most likely to draw people’s attention.
It is also referred to as predictive eye-tracking, as it simulates what will most likely happen in the first 3 to 5 seconds when the user opens up your site. This might not seem like a precise method at first sight, as why would it be more precise than direct eye tracking?
It turns out that AI-based attention heatmaps can predict where users will look at for any given web page with 95% percent accuracy. That’s pretty impressive indeed. Also, it is much cheaper than any traditional eye-tracking method.
All you need to do is run it, take a look at the heat maps generated by the software and make decisions based on the results. If used the right way, it can be an absolute gold mine for your online business. Moreover, attention heatmaps do not require you to have a huge traffic.
The AI-based software can analyze any website even if there are barely any visitors. The only downside is that 5% when the heatmaps generated are not precise. However, this type of heat map is your best choice if you are just starting off and need a cost-effective website analytics tool.
Eye-Tracking Heatmaps
Eye-tracking has been around for a while and it can provide you with precise and reliable data. As its name says, it is a method that is based on measuring eye movement and position. It helps you find out exactly where your users are looking at while browsing your website.
In order to be able to track the eye movement of a person, special eye-tracking devices need to be used. Another method for it is to use the web camera with the combination of infra-red ray reflection to figure out where the person’s gaze is directed.
There are many labs that specialize in eye-tracking and can provide their services to online entrepreneurs. Of course, the user has to observe the website with the device long enough. You end up with enough data to analyze.
There are three widely used terms you need to be aware of when it comes to eye tracking:
- Eye fixation duration – In this case, the heatmap is based on the period of time your visitors are looking at particular spots on your web page.
- Eye fixation volume – This one shows you how many times your visitors have looked at particular elements.
- AOIs or areas of interest – On this heatmap, the web page is divided into different sections based on the viewer’s preference to each one. The elements are basically grouped here.
Although eye tracking is very precise and reliable, it also costs a lot to have a lab conduct such tests for you. Also, it takes a lot of time until you end up with the final data compared to other methods. It requires specific equipment and a controlled environment where the test can be reliably conducted.
If done wrong, the data you get via eye tracking is not going to be accurate enough to draw the right conclusions from the heatmaps. Such tests can take anywhere from days to a couple of weeks.

Which Type of Heatmap to Use and Why?
We have introduced you to all the different types of heatmap tools you can use for your own website analysis. Each one of them has its own benefits and downsides. Now you only need to know which one to use in different situations.
Some of them can be used before you even launch your website such as eye-tracking and attention heatmaps. Based on the findings, you can make some improvements and thus avoid some obvious mistakes before your website goes live.
Next up, we are going to give you some tips on when to use particular types of heatmaps based on your goal:
- Testing your low-traffic website – AI-generated attention heatmaps
- Improving the design of a website before it goes live to get feedback on its current state – AI-generated attention heatmaps
- If you want to show how your website design will perform in front of an audience – AI-generated attention heatmaps
- Figuring out how long a landing page, sales page or blog post should be – Scroll maps
- On which parts of the web page do your visitors spend the most time looking at and which are those parts that they don’t care about at all? – Eye tracking, AI-generated attention heatmaps, Scroll maps
- Identify if a web page is crammed with elements that distract users from the main content or CTA – Hover maps, Click maps
- Identify differences in user behavior across mobile and desktop devices and frequency of interaction – Click maps, Scroll maps
- Which parts of the page do users spend the most time viewing and which are the ones that draw the least attention – Hover maps
- Where do users click at and which are the clickable objects that they avoid – Click maps
- Find out why visitors bounce after scrolling down to a certain part on the page – AI-generated attention heatmaps, Eye tracking, Scroll maps
Now you have a basic idea about which type of heatmap analysis needs to be conducted depending on your goal. Once the testing is done, you can start to draw conclusions and brainstorm for new ideas about how your website should look like. Then, with the help of A/B testing, you can validate those changes.
A/B testing is about:
implementing a new design and publishing it to see how it performs in front of your audience. Both the old and the new version or versions of the web page need to be live. Then, users will randomly get to see one of the versions so that you can collect and compare the data.
The A/B testing method can come in handy whenever you have a new idea or want to test a hypothesis. Such tests can be performed when you relocate a CTA, add or remove a new element, or change the layout, to name a few examples.
Is it Hard to Use a Heatmap Tool?
Designed heatmap tools are for online entrepreneurs. A long learning curve would be pretty bad for business so it has to be user-friendly. A good heat map software also comes with thorough usage instructions and maybe even whitepapers.
Get a trial or a personalized demo so that you can try out all of its features. In this case, you can easily decide whether you want to buy the full product or not. When you buy a heatmap tool for website analysis, you will get a hang of it in a couple of days.
Final Words
Now you have a few practical tips up your sleeve and also understand the fundamentals of using various heatmap tools. Don’t shy away from trying out all the different features, as you will learn a lot by experimenting.
Heatmap tools are outstanding for generating visual representations of data that can help you make informed decisions. You can implement new ideas, make changes, and conduct some A/B testing to find out what works best.
Updating the design and structure of your website is often a never-ending process. By going through iterations, you will be able to improve your conversion rate every step of the way. The more website analytics tools you use, the better you are going to understand your users.
Using the heat map tool is usually not the hard part. It is even more important to understand what you are looking at in great detail. Also, you need to have a goal in mind and choose the right type of heat map method accordingly. You need to ask the question: Which type of data can help me in this situation?
1 Comment
Airline Reservation System
2023-02-16 at 08:00Thank you for sharing a good piece of blog. I read your blogs and managed blogs by myself.