Sometimes, issues with websites are inevitable. Just like not achieving a perfect score on every exam you take, real life has its ups and downs, and it’s uncommon for everything to go smoothly – just as we envisioned. When you or your colleagues are working on developing or upgrading your brand’s website with new features, there’s a good chance something might go wrong. It’s not intentional, of course.
Many people check it from time to time, but no one notices the problem. Incorporating session recording to debug can be a game-changer in these scenarios, providing a clear view of what users experience, helping to identify and resolve these issues effectively.
Table of Contents
Understand customer tolerance
Fortunately, most customers are forgiving. They appreciate your efforts in quickly identifying and resolving the issue, even if it means they have to wait a few minutes due to the inconvenience. But there are some limits that they can still tolerate.
If you underestimate the problem, or you are too lazy to solve it immediately, your potential buyers quickly lose their minds. But I can tell you something more depressive. Sometimes your tools and resources are not enough to find the answer to the issue and fix it even before these visitors start to get angry.
How is that? By just your own, it is so hard to get the answers. In this article, you get a glimpse of one of those tools that can help you debug your site as quickly as possible. After that, you will meet with the common website issues, and suggestions on how this unique tool can help you out of these situations. Are you excited yet? Then let’s start with the beginning.
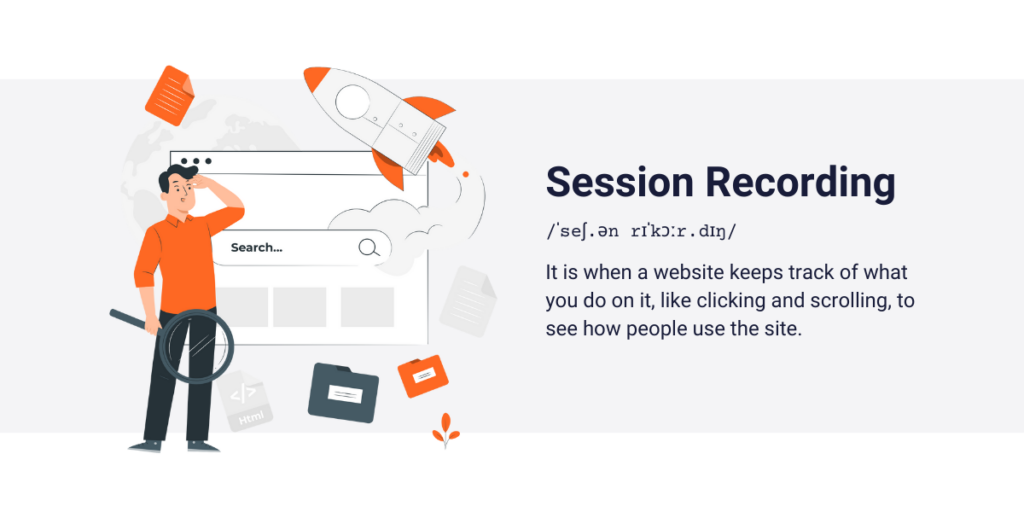
What is a Session Recording tool?
Session recording tools, sometimes called session replays, are the unique tools mentioned in the first chapter. This is a qualitative research tool that helps you analyze your visitors’ individual sessions by replaying them and providing more detailed information. This means you can watch where your site’s visitors clicked, scrolled, or moved their mouse.
Meanwhile, these features highlight the significant moments of these sessions, such as when the visitor clicks on a call-to-action, identifies a bug or completes a conversion. This eliminates the need to watch lengthy sessions ranging from 5 to 50 minutes, which is helpful for effective time management.
In this way, you can gain a deep understanding of your visitor’s behavior, thoughts, and feelings related to your site’s user experience.
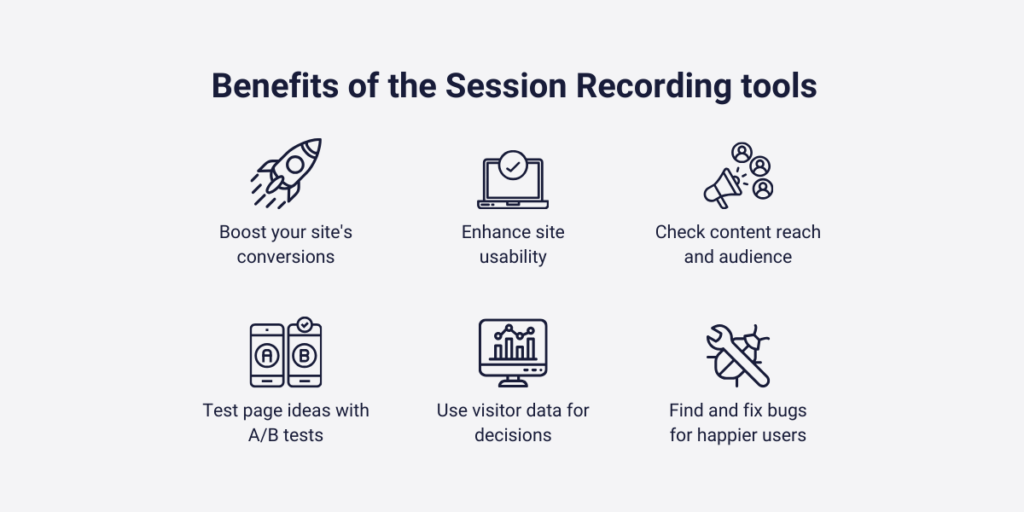
Benefits of the Session Recording tools
There are so many advantages of using session recording tools, and many of them will be mentioned through examples in the next chapter. But before we move on to the debugging challenges and session-recording type solutions, we must conclude this tool’s general strengths and opportunities.
With the help of session recording tools, you can:
- Optimize your site’s conversion rates
- Improve your website’s user experience
- Analyze your content accessibility and target audiences
- Make A/B testing to test different page concepts
- Make decisions based on your visitor’s data
- Pinpoint bugs to create better user satisfaction
Although we could have written about each of these opportunities in detail, in the next chapter we will look at the last mentioned opportunity; bug detection. No worries, we still move on to other aspects, since some of these come from each other.
How to use Session Recording to debug?
It would be a disaster to put all bugs and issues into one bracket. Since all of these require different approaches and solutions, we must know even at the beginning what we are facing.
Let me share with you an example, for easier understanding.
Let’s say that only 2% of your visitors click on one of your call-to-action buttons. Since this number is relatively low compared to the industrial averages, and your own past data, you are searching for the “why”.
With the help of a data analytics tool, you get to know that you have the same number of visitors that you had in the past, and your customers are still interested in your brand. So you are facing a bug, but you don’t know what type of bug it is. 2% of your visitors clicked on it, so you know it’s not impossible to get there, maybe just some of your visitors suffer from something.
- But is it because your site has a slow-load time? – Then you can immediately search for better website providers
- Is it because the mobile layout is wrong? – Then you can introduce a comprehensive layout from one minute to another.
Although you can ensure a quick response to most of these problems, if you try to reset those factors that have nothing wrong, you will lose your critical time.

1. Site navigation issues
Although this title refers to what your search engine writes you down occasionally, here I’m not only thinking about typos which will bring your visitors to non-existent sites. Of course, misspelled URL-s are common website issues, but I categorize the following issues to this subchapter as well:
- URL changes
- Removed contents
- Ended dynamic contents
Somehow all of them are related to each other: you missed updating something. Common issue, but the effect can be bigger than you think.
All of a sudden your site’s conversion rate can decrease down to 0%, if your customers can’t click on a link that moves them to your actual conversions. However, because of this radical change (this almost always comes with a total decrease), it is easy to detect. But to detect it as soon as possible, you need to use a session recording tool.
How can it be solved?
Most session recording tools, including Capturly Analytics, offer two different solutions to detect these issues. These are the detection of U-turns and rage clicks.
U-turns
As its name stands for itself, track if a visitor comes back from one page to another with an immediate effect. This time we can be sure that the user doesn’t find what he is looking for, or something doesn’t work the way it needs to. It can mean two separate things:
- your website’s interior design hasn’t been established effectively
- You have some broken links, or out-of-date CTA’s
Rage clicks
Since there can be two different reasons for possible increased U-turn activities, you must check other factors to be sure about the cause of the debugging.
Like rage clicks. Rage clicks mean numerous clicks to a non-clickable element of a webpage by a visitor, which refers to anger, and – no surprise – rage. Rage clicks are likely to happen, when something on your site doesn’t work, as it needs to, and your visitor doesn’t understand how this can happen. This is an immediate call for urgent problem-solving.
Most of the time common user rage clicks refer to broken links and wrong URLs. Moreover, if you have many examples in both U-turns and rage clicks, you can be 100% sure that your visitors can’t reach one of your pages, or can not move forward to the designated conversion funnel.
2. Javascript errors
Javascript errors are less recognizable amongst both website developers and website analytics developers. That’s because many of the experts don’t take these issues too seriously. And they can not make a worse decision than this.
But let’s start at the beginning:
What is Javascript?
Javascript is a programming language, for creating interactive and dynamic web pages, this is one of the best choices. Javascript error detection on session recording tools is programmed to give you clear instructions when one of your customers experiences a programming issue during its stay.
That’s what most of the session recording tools know nowadays, but that’s just the tip of the iceberg. In reality, there are at least six common Javascript errors, and there is a very big contrast between how you must handle each of them. I wouldn’t like to talk too much about the different types of Javascript errors, that’s because we have already done it once. But let’s analyze two different Javascript errors, and how we handle them differently.
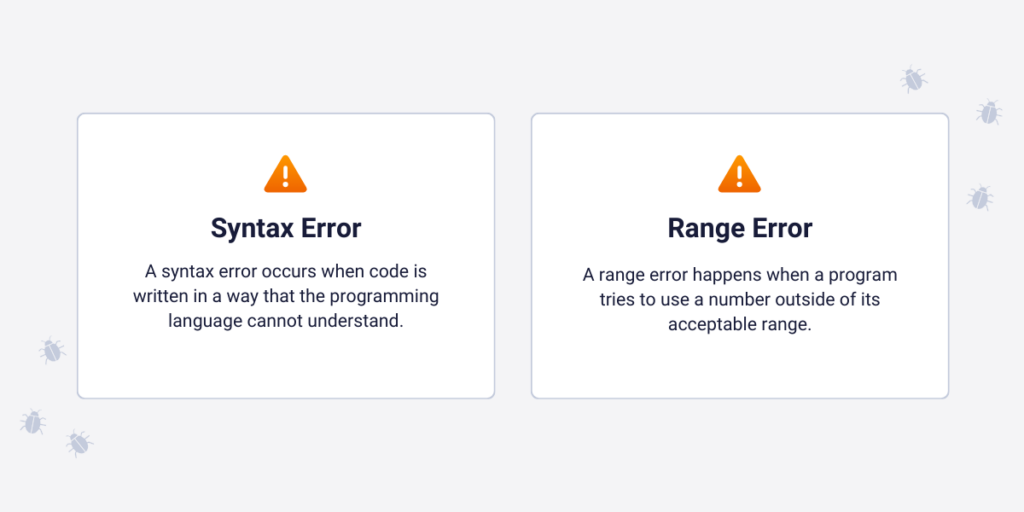
Syntax Error
Syntax Error means that there’s something wrong in the code. Your team misspelled words in the code, added unnecessary words, or spoiled the whole structure.
These all require the same, little solutions, but the real thing is: after you check how important that segment is where this problem occurs, and how many of your visitors are affected by this mistake, you can fix the bug immediately.
Range Error
Imagine you’re playing a game on a website where you can only collect up to 10 stars. If you somehow manage to collect an 11th star, the game doesn’t know what to do because it was only designed to handle up to 10 stars.
This is similar to a computer error called a Range Error. It’s like the game saying, “Wait, I can’t hold more than 10 stars!” and then it sends you a message that something went wrong.
This happens when a website or a program gets a number that’s too big or too small for it to handle. Just like in the game, when this error pops up, it might mean there’s a bigger issue behind the scenes that needs to be fixed.
Summary
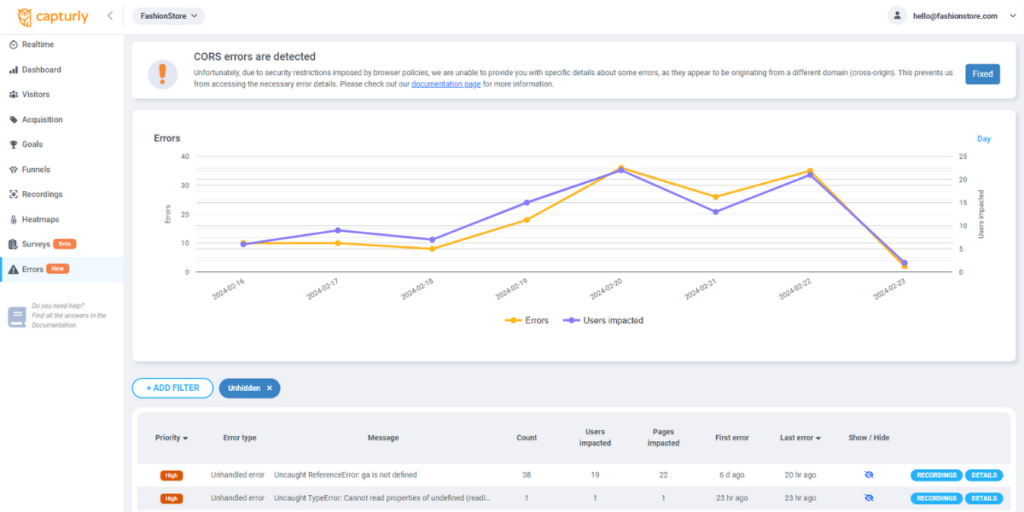
That’s why categorizing these Javascript errors into different brackets helps you to make more informed decisions, even before a tremendous tragedy happens. But there are just a few session recording software on the market that can do that effectively. One of them is our tool, Capturly Analytics. If you want to read more about the different types of Javascript errors, and the relevance of highlighting Javascript errors you must check this!
Website issues based on the different web usage
Sometimes a bug does not affect all of your customers, just a bunch of them. Why is that? Because they can not be categorized as the same. They can use different devices (mobile phones, tablets, personal computers), different browsers (Chrome, Firefox, Safari), or different operating systems (Windows, Mac, Linux).
Sometimes your website needs personal care to optimize it to all of these possible usages. Situations can occur when the problem doesn’t come from the natural webpage, but instead from one of these re-designed, tailored web pages that is connected to just one of these possibilities.
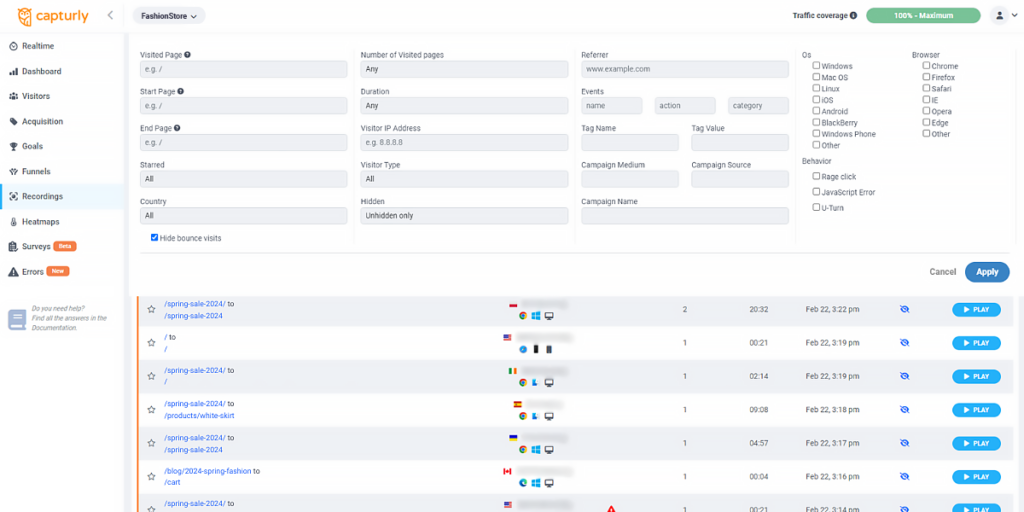
Even if you would use session recording software, it would take weeks to sort all of these different sessions, and users, and detect the source of the problem. That’s when session recording filtering takes its place to save you! However, this filtering option only grabs its place in the most versatile session recording tools, due to its little complexity. However, Capturly Analytics not just offers you these filtering options, but a bounce of others, just as:
- Pinpointing sessions from different countries
- Highlighting session with the chosen number of page numbers
- Analyzing user sessions based on different time intervals
And a lot more! I encourage you to try them out one by one, as you can find crucial information from the given data, even if you think your site hasn’t got any issues.
Slow bug detection
Without session recordings, issue detection is a slow process, that’s crystal clear. However, sometimes with session recording tools, this procedure can be as slow as a turtle as well. It all depends on when you get your user data. I really don’t like those session replays, when more than 4 hours pass between the single user’s recorded session, and when you get access to that recording. It really can mean a lot. If you detect a critical problem, you need urgent problem-solving, but how can you solve a problem that you cannot really watch? There’s no way.
And that was one of the key problems with session recordings, but the answer quickly came. Live session recorders appeared on the market, where you can’t just immediately observe the sessions after the customers finish them, but you can analyze them while they are still in the session! This is a must-have feature since it opens you to other gates: for example, if one of your visitors gets stuck, you can offer him immediate help, without further and more complex contact.
The thing is, unlike its effectiveness, not many session recording tools use this system, however, the biggest ones have all introduced this already. Would I need to mention that Capturly Analytics is amongst these session recording tool providers?
Conclusion
This article was all about introducing you to how session recordings can save you some time, and help you to detect and explore your bugs.
In the first few chapters, we took a look at what session recordings are really, and what general benefits they have mostly. After this, we moved to the most common issues session replay tools can help you avoid.
We had a word about missed updates, Javascript errors, errors of small target groups, and slow issue detection. During the introduction of these common bugs, we offered you some help with session recording tools. This tool can really help you out in these tough situations, and not just give you a couple hundred satisfied clients, but sometimes it can give you the future of your brand.
So we recommend you use it on a daily basis to save some stressful days in the future.