![Cart Abandonment Rate by Industry 2023 [Benchmarks]](https://capturly.com/blog/wp-content/uploads/2023/11/Cart-Abandonment-Rate-by-Industry-2023-Benchmarks.png)
You might think that once customers have reached the final stage of their online shopping journey, there is no going back. However, the reality is somewhat different from this assumption. E-commerce companies often believe that customers can return the package even after delivery without paying additional costs, including the delivery fee.
Today we will not focus on the final steps, but rather on a critical part of the process – the acquisition stage. At this point, the buyer has already chosen your site because it best met their requirements. They’ve decided on the products and their quantity, put them in the shopping cart of the online store, and moved to the payment phase.
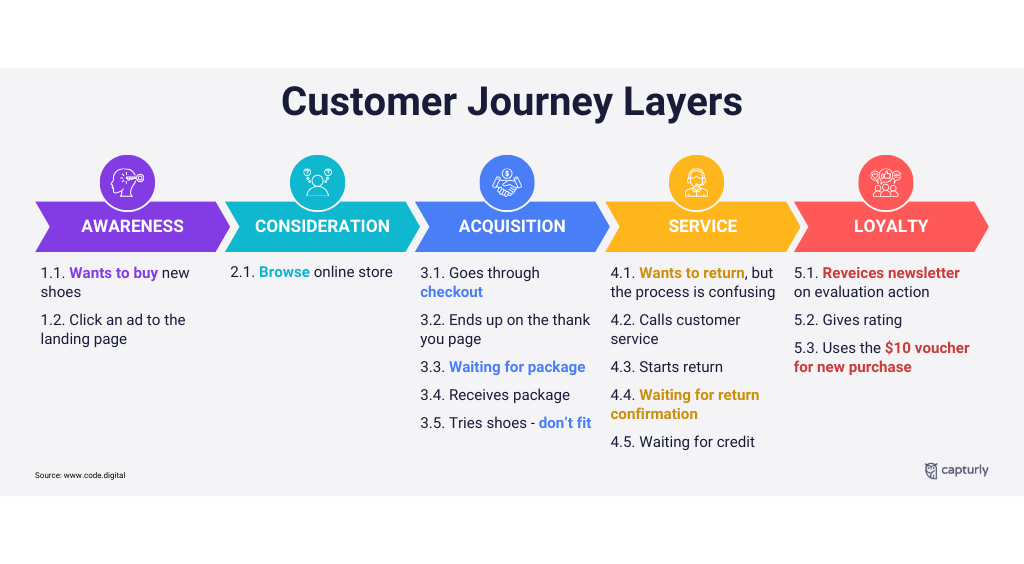
However, something unexpected happens. At this stage, where success seems almost certain, many customers abandon their shopping carts. Such behavior challenges our understanding of human nature.
If they chose us, why do they change their mind right before they make a purchase? If this is a common practice, is there anything we can do to prevent or at least reduce it?
Which industries are most affected by this negative behavior and conversely, which industries can we be more satisfied with? These are the questions I intend to answer as we explore this topic together.
So stay tuned for valuable information!
Table of Contents
What is the abandoned cart rate?
Before I drive you through a little math-orientated topic, first I advise you to start something easier.
There are two types of cart abandonment:
- the customer closes the webpage right after the checkout page pops up, and doesn’t come back for 30 minutes.
- The customer’s device (which he used to reach the checkout page) remains untouched for at least 30 minutes after the checkout page pops up.
Both of these scenarios are called cart abandonment. But, we need a little more in-depth understanding, that’s why it is crucial to face not just the term, but the rate itself.
How to calculate cart abandonment rate?
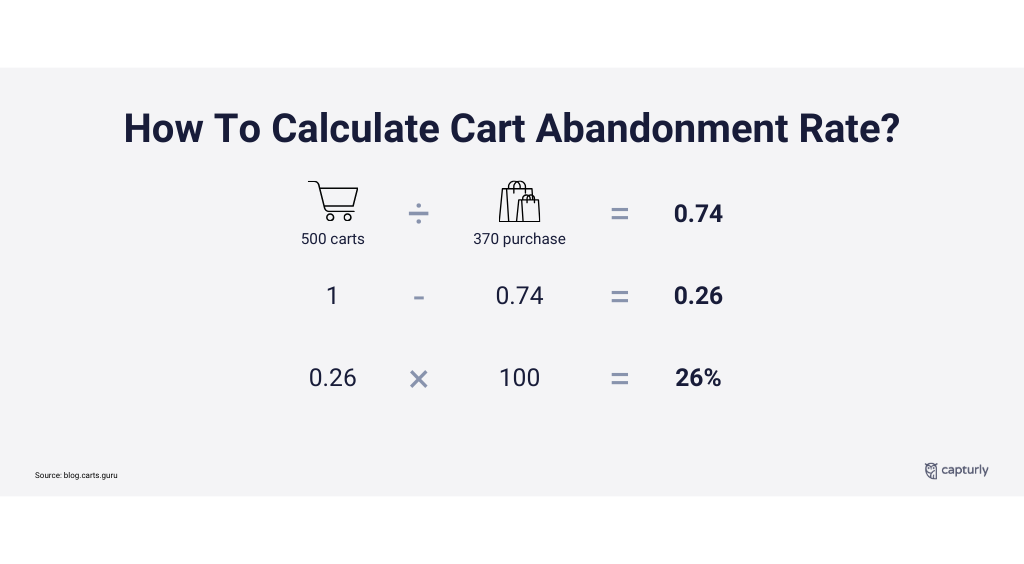
The shopping cart abandonment rate is calculated with a simple formula. We need to divide all of the completed purchases that happened between a specific time interval, with the number of created shopping carts examined between the same interval.
As there is no possibility that the completed purchases will be a higher number, than the created shopping carts, (just think about it, every purchase needs to start with a shopping cart creation) this means the result of this equation cannot be more than 1.
After multiplying the given number with 100, we will get a percentage ratio. If we calculated with the right numbers, used by the same time interval, we get our site’s cart abandonment rate.
Why is the cart abandonment rate important?
I touched on part of the answer at the beginning of this article, but let’s take a closer look. Why should we care about this metric?
There are two answers to this question. One is related to profit maximization while the other is related to technical opportunity. Let’s start with the first one.
Consider the maximum number of users you can serve in a certain period of time, for example 1000 buyers. If you exceed this amount, you will not be able to coordinate deliveries on time, which will lead to frustration for many customers. Sure, you can serve more with a few system upgrades, but progress will only happen if demand is consistently high.
Don’t worry; sometimes your website can attract 100 times more visitors than the maximum number of users it serves, but most will lose interest at some point.
Think of it as a funnel; visitors have specific goals to reach the checkout, but many change their minds. Sometimes only 1% of first-time visitors make a purchase. Is this something to worry about? Not at all!
If you have as many buyers as your maximum capacity in a given period, you don’t have to worry if you don’t want to expand your system. In most cases, however, the scenario is different: there are fewer buyers than you can serve. In these situations, you can increase revenue and profit margins by reducing cart abandonment rates.
But there is another reason to analyze this number regularly. Sometimes abandoned carts are caused by a technical problem rather than normal human behavior. This could mean that one of your buttons is not working well, or there is a bug in the system, etc.
In this case, customers want to continue their journey, but an external factor prevents it. In this situation, finding a solution to the problems is even more important than in the first example, because it affects users who really want to buy something from you.
Why do customers abandon their carts?
There can be many reasons why people abandon their online shopping carts, and different industries can have their own unique reasons for this behavior. This section of the article discusses the most common reasons that can apply to all industries.
Several studies in recent years aim to understand the main reasons for cart abandonment. Although they all identify similar factors, it remains unclear which are the most important.
This brings us to two main topics:
- These studies are often based on trends from previous years and technologies that may no longer exist.
- The study is based on aggregate scores from online surveys and forms, which are not truly “representative” as respondents are not randomly selected.
Despite these limitations, we still gain valuable insights from these studies. For example, in the United States, a survey by Statista in 2015 revealed that the main reason for abandoning the shopping cart was unexpected shipping costs (25%). This is understandable, as customers do not want to pay more than agreed. However, sometimes high shipping costs are due to regional and geographical reasons, like customs duties for a UK-based e-commerce shop outside the EU from 2021.
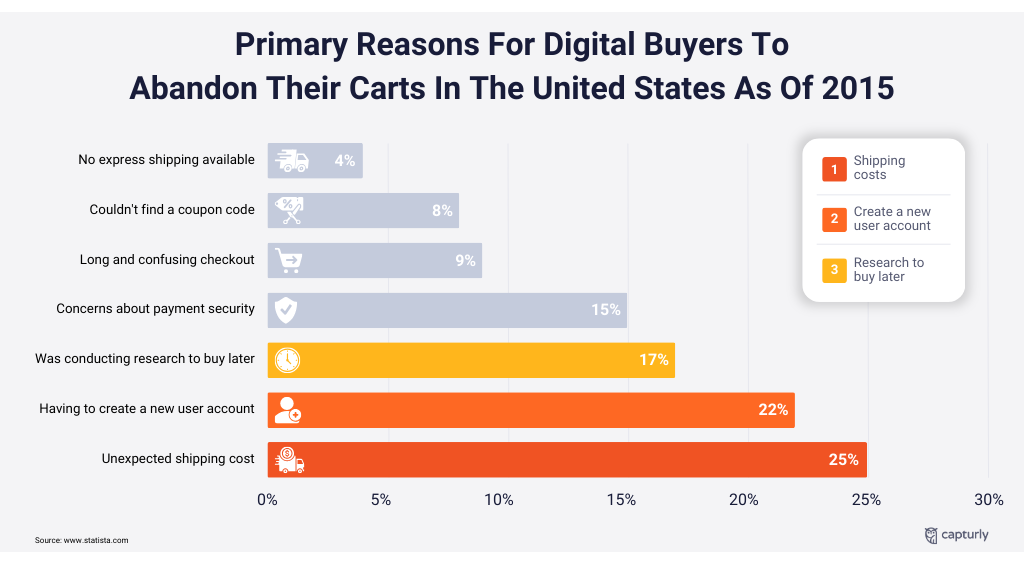
Another reason (22%) was the requirement to create a user account to make a purchase. Although some e-commerce companies claim to require personal information for orders, this information can be requested a little earlier to avoid disappointment.
The third reason (17%) is that buyers are unsure about the purchase and want more information. Websites can improve this by highlighting their strengths and offering compelling reasons to customers.
A more recent survey from 2023 based on 2,219 respondents’ opinions, obtained similar results but allowed respondents to choose more than one answer. Therefore, the percentages are higher compared to the previous survey.
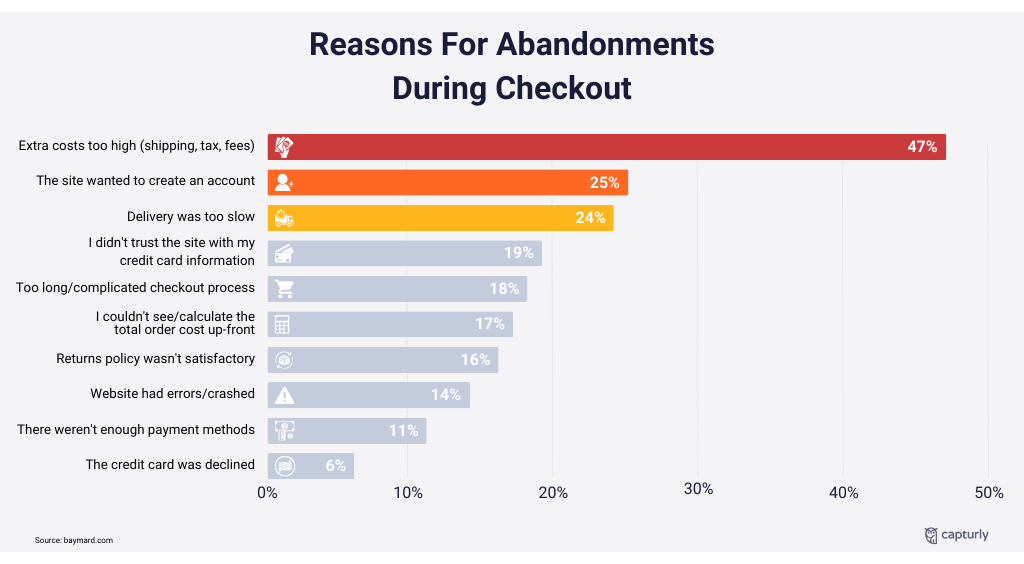
In this study: 47% of respondents abandoned their cart due to high additional costs.
25% cited the requirement to create an account as the reason for possible rejection.
A new finding was that 24% of respondents abandoned their carts when delivery was slower than expected. Although this may be unavoidable due to logistics, using faster shipping companies can help solve this problem.
Having explored the common causes of cart abandonment, it’s essential to understand its significance, especially if it occurs frequently.
What is the average cart abandonment rate?
If we examine all the different industries that exist in the online space to find out the average shopping cart abandonment percentage, we might be a little disappointed.
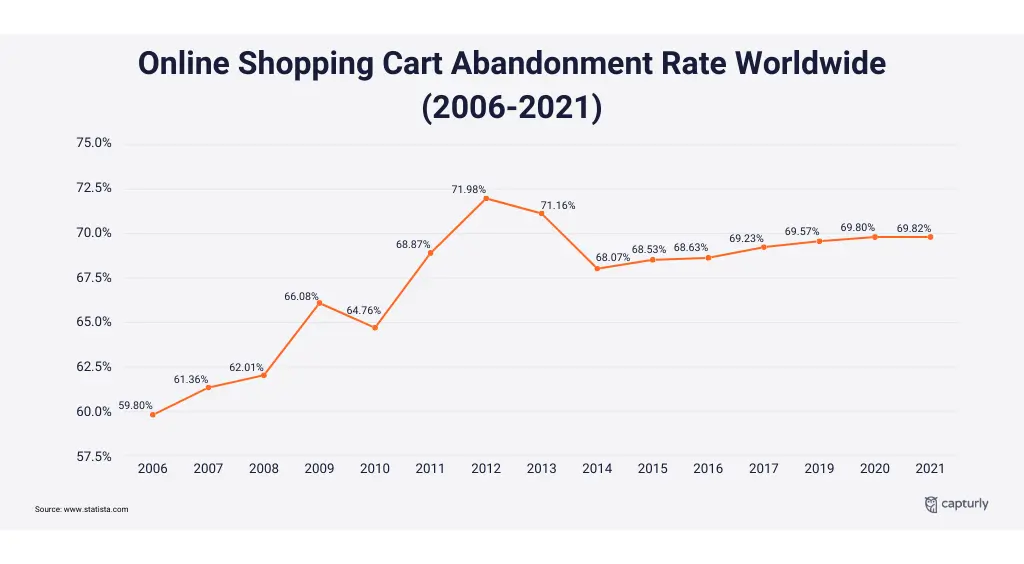
According to Statista, the shopping cart abandonment rate in 2021 was 69.82%. It means that in 2021 every 7 of 10 potential buyers rather changed their minds and didn’t buy anything, instead of ending their buying journey successfully. That’s a huge number!
Although, you may say that this statistical analysis has been working with old data, and two years before today it was an uncertain time due to the Covid pandemic, so we might not attach these numbers to the present trends. So I looked for newer research.
Dynamic Yield, a well-known optimization platform, has been making E-Commerce benchmarks for a long time now, and their benchmarks are trusted by millions, so we should take a look at their data. One of their last benchmarkings, which is about shopping cart abandonment rate, was published in 2023, so it may bring us to more precise data. They found out that between November 2022 and October 2023, the average cart abandonment rate was 71,61% globally, which includes every sector’s data.
This is even bigger than it was in 2021. So, there is no proof that the Covid pandemic had at least slightly changed these data, or somehow influenced them.
It is also very interesting, if we take a look at the 2004 to 2023 period, whether the average cart abandonment rate was always this high, or a long trend has been showing up. That’s where I also use Statista’s in-depth analysis and long-term data storage. Out of their data in 2006, the average shopping cart abandonment rate was only 59,8%. By 2009, this number had increased to over 65%, the peak was in 2012, when this number had almost climbed to 72%. Since 2012, the lowest number they had calculated happened in 2014, which was a little more than 68%. By 2021, the average number hadn’t moved significantly; it stayed between 68,5% and 69,82%.
Why do different industries have different cart abandonment rates?
Why do different industries see different cart abandonment rates? First, let’s be clear: the earlier data was all about finding an average percentage.
That doesn’t mean your industry will have the same data. In fact, this rarely happens. In some industries, the percentages are lower than average, but we’ll also look at examples on the other side.
But before that, it is necessary to understand why these percentage values differ from industry to industry. This is a complex question with endless answers.
Consider the following factors:
- Product Type – Industries with larger and more complex products may have higher cart abandonment rates. Buyers might think more before buying something large and complex compared to everyday items. Here, you may face logistical problems, issues with delivery, or the lack of expertise who may help them.
- Price range – Industries with more expensive products may also experience more cart abandonment. Customers may think twice if the price reaches a significant part of their monthly budget. It is also important whether the potential buyer finds the desired payment option; otherwise, it may result in cart abandonment.
- Nature of Purchase – Industries that sell luxury products often struggle with high cart abandonment rates. Impulse buying is more typical for cheaper products, which results in more completed deals.
- Product customization – In some industries, choosing the perfect item isn’t complete when you add it to the shopping cart. For example, in online car purchases, you might only choose extra elements at the end of your shopping journey. Industries like these tend to have higher cart abandonment rates because decisions may change based on the final price with added elements.
But this is only the beginning. There are hundreds of other factors that lead to higher or lower cart abandonment rates, some of which are unrelated to the industry itself.
In the next few pages, we’ll dive into the data of the most important E-Commerce industries to see how cart abandonment rates affect them individually.
Notes about our data, and the analyzed industries
This is the average cart abandonment rate from the designated 6 industries, mostly from November 2022 to October 2023. This will show us how much these trends usually evolve in a single year. Furthermore, we are also trying to give you explanations about immediate increases, or decreases, which can have several causes, as I already mentioned.
The six industries that we will examine more precisely, are:
- Fashion, accessories, and apparel
- Pet care and veterinary services
- Luxury and jewelry
- Beauty and personal care
- Home and furniture
- Food and beverage
Let’s start to examine them separately!
Apparel
Compared to the overall percentage ratio which was 71,61% globally between November 2022 and October 2023, according to Dynamic Yield’s research, the fashion industry has a higher percentage of cart abandonment rate, here the average rate is 77%.
If we examine a monthly shift, we can find out some other interesting parts. First of all, between the measured period (November 2022 to October 2023) the smallest value was 74% which belongs to December 2022. Moreover, the second smallest value is connected to November of 2022.
This may mean that the appearance of Christmas may cause a decrease in the shopping cart abandonment rate in the fashion industry. This can lead us to a very interesting conclusion: if we buy gifts for others, and not buy something just for our own use, we more often take risks, and buy the products or the service, even though we are not satisfied with one or two factors. In the other case, if we are looking for products just for our own use, we may search more E-Commerce fashion sites to find the perfect product. This behavior is absolutely true in the fashion industry.
The maximum values were from January and February of 2023, maybe this is also the effect of the Christmas gift-giving. Sometimes we tend to realize how bad deals we have set through Christmas, so the next two months are all about thinking out every decision.
Here is the whole year’s average cart abandonment in the fashion industry.
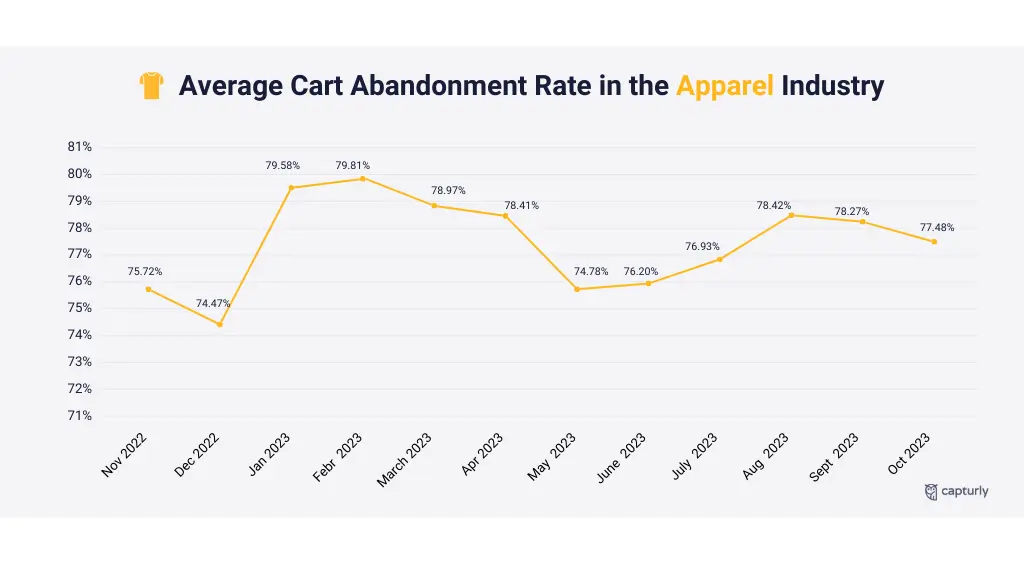
Average shopping cart abandonment stayed between 80% and 76% in the whole examined period, which means it is a very constant industry in terms of cart abandonment, and a very quick change is rare.
Pet care and veterinary services
This industry is a little odd, compared to the fashion industry’s balance that we experienced before, but let’s start with the beginning.
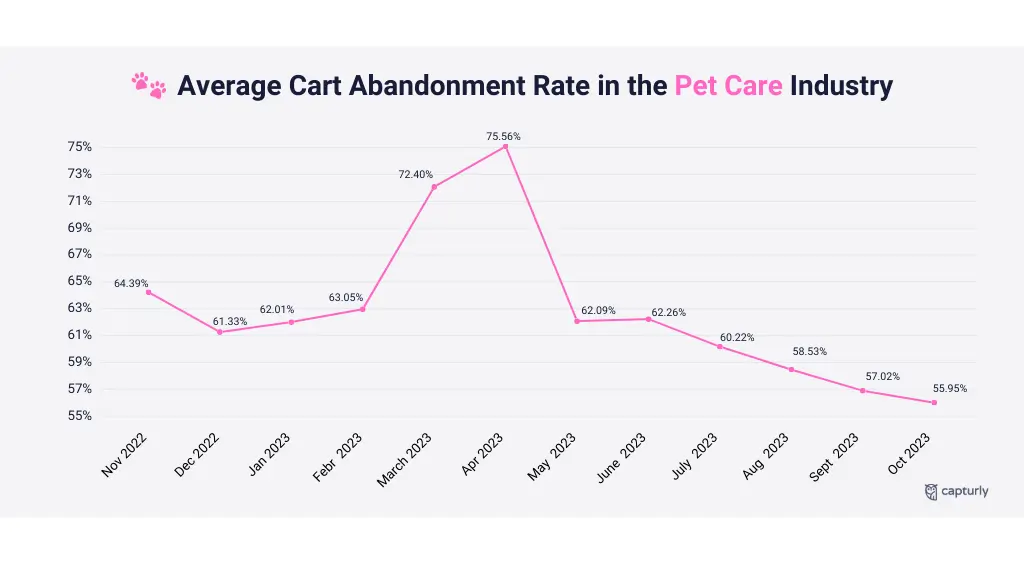
The average rate of cart abandonment here is only 63%. Since the average cart abandonment rate was 71,61% globally, it means that the pet care industry’s average is 8 percentage points lower than the overall average rate. This is the second-lowest industrial average value that the mentioned industries achieved.
This difference may come from the fact that these products and services are usually cheaper than other industries’ prices. Moreover, veterinary services are occasional expenses, but when it is needed, it is urgent to solve the issue immediately. In those cases, people rarely compare prices or are rarely unsatisfied with different factors. Here, people just walk through the whole buying process as a natural need to avoid the catastrophe.
Now, let’s see the minimum and the maximum values. The minimum value is connected to October 2023, when it was 56%. This industry achieved the maximum abandoned shopping cart rate in April 2023, when it was 75%. The first thing that came to my mind during the analysis of these data is the huge difference between the minimum and the maximum values. It is a 19 percentage point gap. As I said earlier this is an industry-specific factor. It is very changeable at what time we urgently need these services, and what time it is not that necessary.
If we analyze the whole one-year period, we may end up seeing a positive change. In November 2022 the average cart abandonment rate in this specific industry was 64%, however, in October 2023 it was just 56%. This means it is less likely that this year’s data will climb that high, than last year.
Luxury and jewelry
This industry is not directly made to be a slice of the E-commerce world. These shops usually struggle with the fact that it is way harder to show their uniqueness and luxuriousness than in a brick-and-mortar shop. However, due to the higher and higher number of online buyers, it was also necessary for them to establish their online presence. The COVID-19 pandemic once and all showed these brands that if they want to survive these situations, creating an online shop is mandatory.
So many brands created their online shops, but most of us are still suffering. The 2022’s-2023’s data still show that, but with some positive news. In this section, we have two different types of research, which all help us to find a conclusion. Our first data is coming from 2022, and the other is from November 2022 to October 2023.
According to Monetate’s benchmark, where they examined shopping cart abandonment from 2022, they got 84% of shopping cart abandonment if we converted their quarterly published data into one overall average.
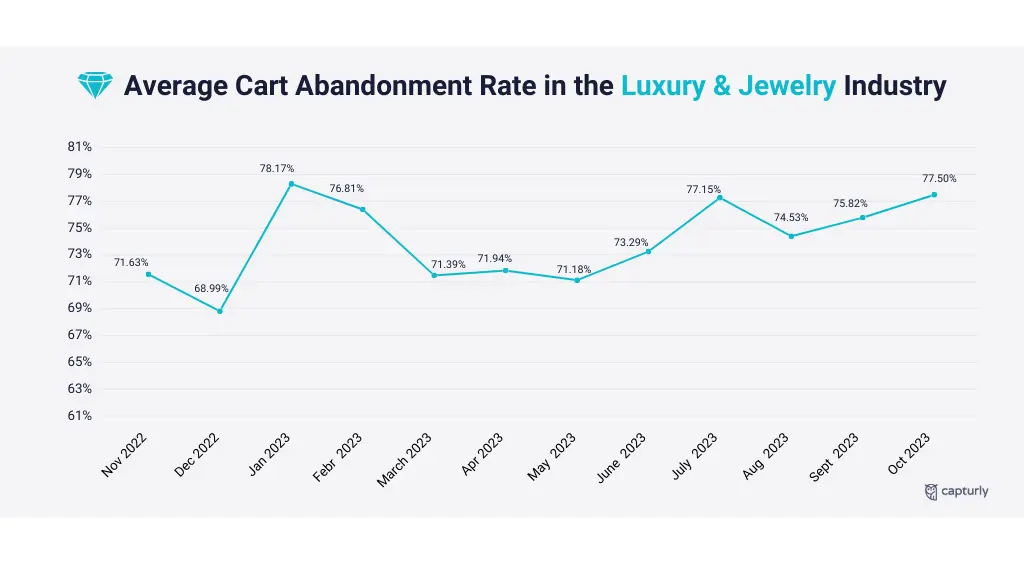
On the other hand, Dynamic Yield’s research shows that in their examined period (November 2022 to October 2023) they measured a 74% overall cart abandonment rate in the luxury and jewelry industry.
It may mean two things:
- One of the research is less efficient than the other
- The luxury sector finally awakened from its online dream and found out how it can be more efficient
If we examine Dynamic Yield’s research a little bit more in-depth, we will see other very interesting facts. Out of their own research, the lowest percentage of cart abandonment rate in the luxurious industry happened in November 2022, when it was 69%. The biggest monthly percentage was 78%, which happened in October 2023.
Their data also shows that in the last couple of months, the cart abandonment rate in the luxurious industry has increasingly gone up. It was 71% in May 2023, and it almost continuously increased until October 2023, when their research ended.
Beauty and personal care
Beauty and personal care is a very constant industry. There is a group of buyers who always have a need for these products and services. That’s why here, cart abandonment rates connected to different months may not vary that much. But before we examine that from Dynamic Yield’s data, let’s see this industry’s average cart abandonment percentage in the examined period.
It was 83%, the biggest one out of all the examined industries. There is no clear answer, that explains this surprisingly high overall percentage, so I bring a few theories in:
- Comparison shopping is typical in this industry
- These products sometimes have specific suitability requirements based on skin type, hair type, or other personal preferences
- Inability to test products online
- Limited product information
If we examine the data in a monthly manner, we can find out that the research has a correlation with the first statement.
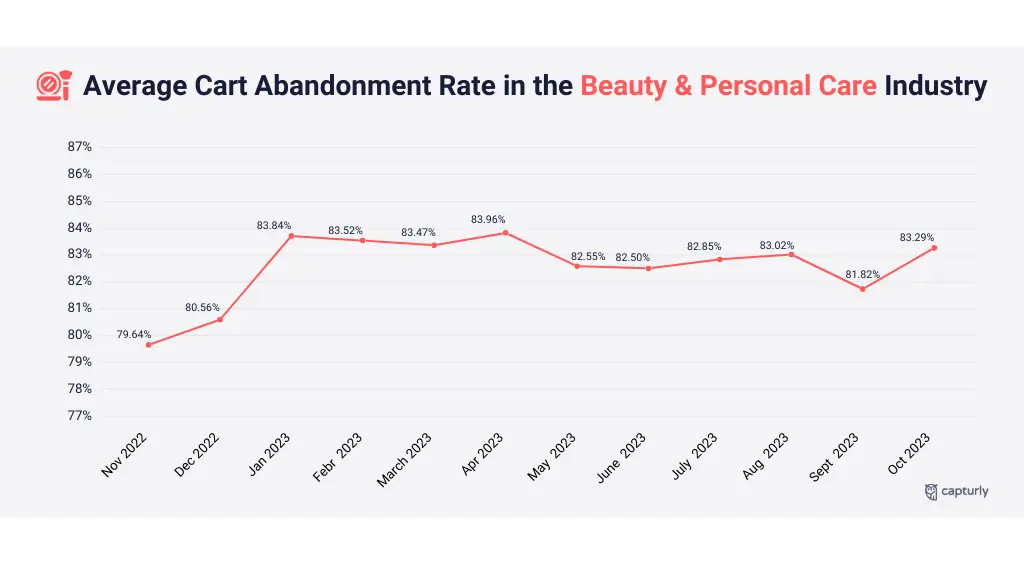
As you can see every month cart abandonment percentages in this industry are between 80% and 84%. There is no other industry with less difference between their minimum and maximum values.
Home and furniture
In this industry, the average price of sold products is relatively high. This means that probable buyers are thinking twice whether they want to go through the shopping procedure or abandon their carts.
Thus, it was not a coincidence that according to Dynamic Yield’s research, the average cart abandonment rate in this industry in the studied period was 79%. That’s 7 percentage points more than the shopping cart abandonment including all industries.
Other factors, like a slow delivery time, the option of cash on delivery, or an option to help the buyer with putting the product inside the house may all decrease shopping cart abandonment.
The data also shows us that as in the case of beauty and personal care products, there are also no seasons in the home and furniture industry where potential buyers tend to reconsider their purchase more often.
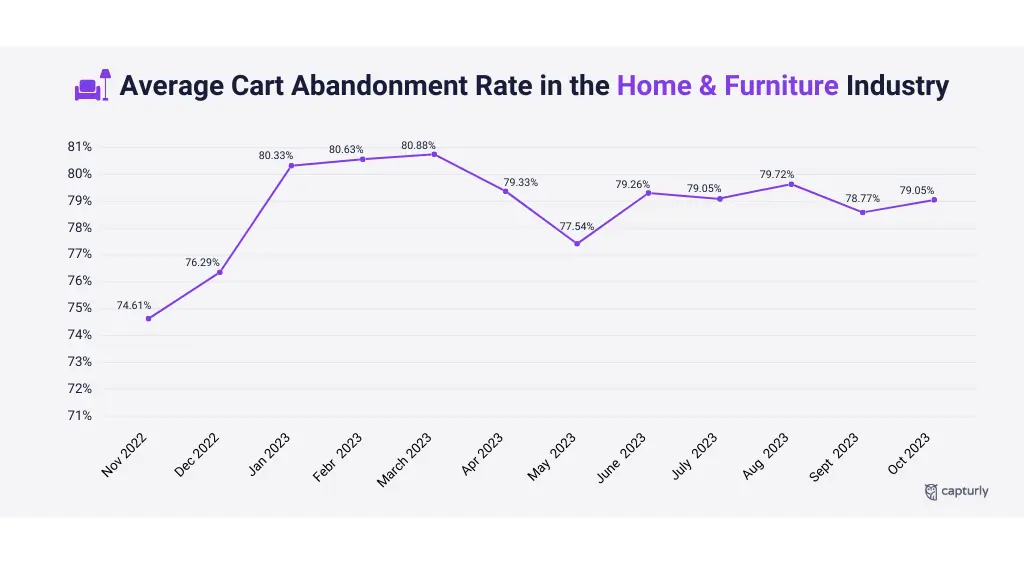
The minimum value inside this one-year studied period was 75% (happened in November 2022), and the maximum was 81% (both in February and March 2023). It’s just a 6% difference, which is a normal value.
Food and beverage
Last, but not least, we will examine the cart abandonment rate of the food and beverage industry.
Compared to the cart abandonment rate in every industry (almost 72%), the food and beverage industry has a magnificent rate of 44%. It is the second smallest average value out of all the industries that are mentioned in this article.
But why, what’s the explanation for this low percentage value?
According to Marketsplash’s analysis, they ended up finding two reasons behind this attitude:
- the necessity of the products often leads to higher purchase completions.
- For consumer goods, a smooth user experience, competitive pricing, and the utility of the products may contribute to lower abandonment rates
Now let’s see this industry’s monthly cart abandonment rates from the examined period.
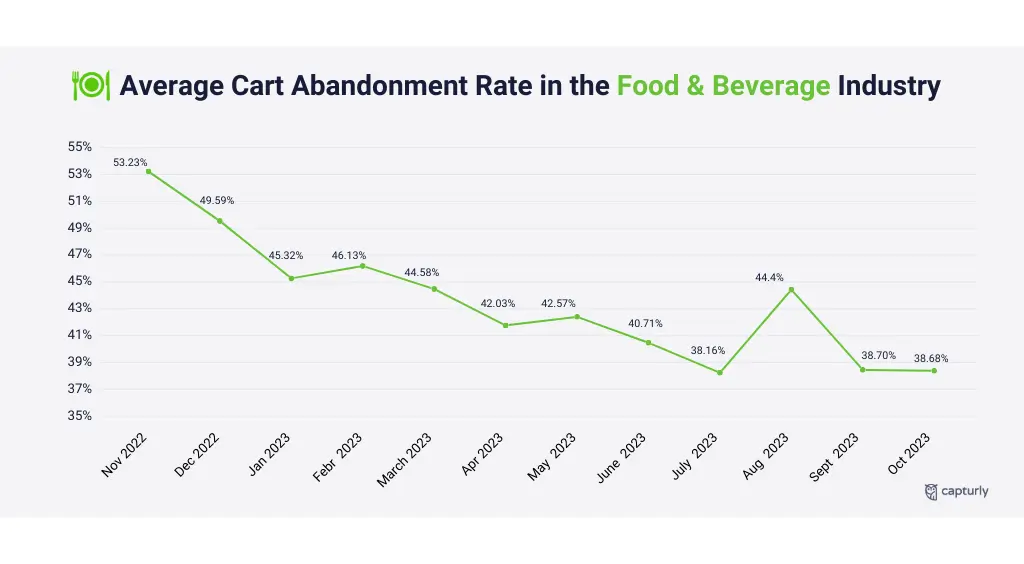
The graph shows us a very changeable monthly percentage ratio. The minimum value was 38%, which happened in July 2023, whereas the maximum was 53%, from November 2022. This is a 15 percentage point difference that is relatively high compared to the scores we have already found in other industries.
Conclusion
Don’t be afraid if you noticed a relatively high cart abandonment rate in your industry as an effect of this article or some other pieces of research. The great thing is, as I already mentioned, cart abandonment rates just occasionally depend on the actual industry you are in.
Instead of these, it can depend on your own individual strengths or weaknesses.
For example:
- Establishing a transparent website
- Looking after the potential buyer’s thoughts and comments
- Continuous bug fixing
- Giving crucial information to the buyers before the purchase
- Making the whole shopping procedure more easy
If you want to achieve lower cart abandonment rates on your E-commerce website, it is good to know the specific industrial statistics that you are in. But it’s nothing without examining the individual opportunities that can change shopping cart abandonment rates faster than industrial trends will.
1 Comment
doodle baseball
2023-12-05 at 04:30Competition is increasingly intense, so any profession needs to be more meticulous