
Why is it important to track our website performance?
The reason is simple: by staying on top of our metrics, you can identify the major gaps in your strategy and even predict the future of your business.
You are what you measure.
As one of the most traditional and highly accessible analytics tools, Google Analytics has remained a fundamental tool in every digital marketer’s arsenal.
Even though it has certain disadvantages and usually cannot be used alone, GA still lets you observe your online performance through different stages of a funnel, from the mere acquisition to customer conversion.
When used properly, Google Analytics can tell you how relevant your website is to your audiences, how much time they spend on your site, what they do once they land on it, whether your site is growing as expected and, above all, whether it’s converting.
Sure, to get the most out of your data, you first need to choose the right metrics to track.
Table of Contents
Goal Completions and Conversions
In a recent article called for Louder Online “Are You a Slave to Your Data? How Taking a Narrow View of KPIs Can Limit Growth”, Gian Clancey explained how data we collect can ruin our online performance, if not tracked properly. She reminds us of the dangers of measuring a quantity over quality of leads, focusing on the short-term metrics, and prioritizing a narrow data-driven focus over marketing creativity. Insights from an SEO agency like this show us that in addition to a reliable tool, website analytics requires lots of planning and strategizing, too.
You first need to set clear and specific goals, build your marketing plan, and set realistic KPIs around them. Only then can you choose the right metrics that are in line with your goals. In other words, you first need to ask yourself what you expect your visitors to do once they land on your site. Do you want them to sign up for your newsletter? Is your goal to boost your brand value by providing exceptional content? Or, you simply want to motivate them to buy from you

When setting up a goal in Google Analytics, click on “New goal.” Google Analytics lets you create your custom goal or choose the pre-set goals. Sure, while the latter option is simpler, the first one is more reliable as it lets you tailor your goals to your deeds. There are four basic goal types to specify, including a destination URL, the number of time people spend on your website, the number of pages they visit per session, and an event that stands for conversion (a button click, eBook downloads, etc.).
The Bounce Rate
The bounce rate is one of the most important website performance metrics. Google defines it as a single-page session on your website. Obviously, in that case, a bounce rate is the percentage of all your website’s sessions in which visitors viewed only one page and then left without taking any additional action.
A while ago, Avinash Kaushik, the website analytics guru, illustrated this metric through the “I came, I puked, I left” example. In other words, a bounce rate is almost always an indicator of your site’s user-friendliness, quality, or relevance to your target audience. If it’s high, then it further triggers poorer engagement and conversions, informing Google that your site is not good enough for your audiences. Consequently, this may hurt your SEO rankings, as well as your overall online visibility.

Now, the rule of thumb is that the bounce rate between 30% and 50% if optimal, while anything above 70% is considered bad. However, this varies based on numerous factors. For example, for single-page websites, the bounce rate can reach 90%. As this is inevitable for such simple landing sites, the bounce rate cannot be considered proof of their quality.
Also, bounce rates vary across different industries. For example, retail sites may have a 20-40% bounce rate, while service sites have a low bounce rate of only 10-30%.
This is why Google suggests that we should look at the bigger picture when measuring the bounce rate. For instance, instead of tracking a whole-site bounce rate solely, you should also track it the bounce rate for a single page or a segment of your site. This is how you will make your stats more meaningful and understand what aspects of your site need improvement.
Average Session Duration
Google Analytics identifies a session when a user visits your site. A session begins once a user lands on your page and ends after 30 minutes of inactivity. Every interaction between a user and your site during this “active” period, from clicks to transactions, is a part of one session. So, if a visitor kicks your site and visits it again, this next visit would be counted as the next session.
In other words, measuring unique website visits doesn’t make sense, as each visit by a single person is identified as a separate session.
However, just tracking your sessions in website analytics is not enough. To truly understand your website performance, you need to know how long your target audience stays on your site on average.
And, this is where the average session duration steps in. It represents the total duration of all your website sessions divided by the number of sessions.
As for the average session duration, Databox recently did a research study, where they concluded that 41% of websites have a session duration of 2-3 minutes.
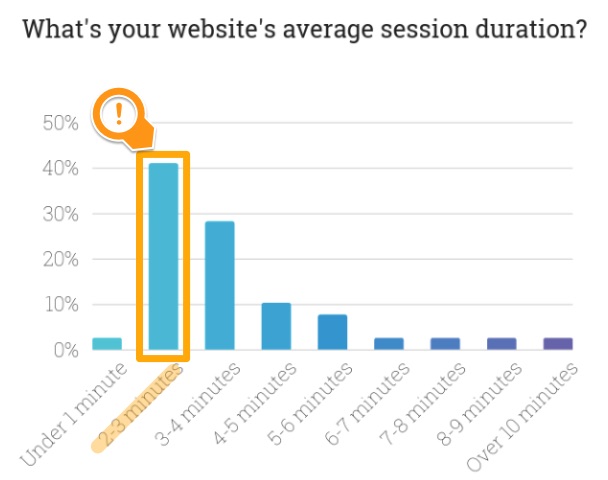
When asked, 55% of marketers said that their session duration is greater than 3 minutes, while 27% reported a session duration higher than 4 minutes.
Now, determining a good session duration is difficult, as it depends on multiple factors. For example, individual session duration depends on whether there were engagement hits on the last page of the session.
If there were no hits, then Google Analytics will calculate it by subtracting the time of the first hit on the last page from the time of the first hit on the first page.
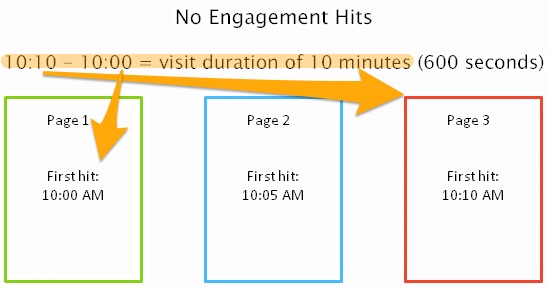
On the other hand, if there were engagement hits on the last page, then the duration is calculated by subtracting the first hit on the first page from the time of the last engagement hit on the last page.
One of the most effective ways to track your average session duration is to measure it for each individual source of traffic, like organic, paid, social, direct, email, and so forth. You can even further segment each of these traffic sources to understand which users engage with your website content best.
Pages Per Visit
Measuring the average session duration is important, but it’s not always reliable. Let’s take an example: A user clicks on your site and their phone rings. They answer a call and they forget to close your website’s tab. Even though they didn’t engage with your site, their visit is still counted as a session. This is why the average session duration is not always an indicator of your site’s relevance.
To ensure that your site speaks to your target audience and delivers value to them, you also need to track pages per session.
Pages per session are calculated in a simple way, by dividing the total number of page views by the number of sessions. This metric is super-easy to track in Google Analytics. All you need to do is hit the “Overview” tab under the “Audience” section.
Namely, your goal is not only to grab people’s attention and get them to click on your site. On the contrary, you want to engage them and build stronger relationships with them at every touchpoint. Your goal is to provide value to them and inspire them to explore your site, click on multiple internal links and, ultimately, convert.
If someone starts browsing around and reading your content from beginning to end, this is an obvious indication that they consider your site relevant. If, on the other hand, people leave your site after viewing just one page, this may mean that you’re either targeting the wrong audience or that your content doesn’t resonate with them.
Over to You
To get the most out of your online performance in this highly competitive digital marketing landscape, you need to set clear goals and tie them to the right metrics. Every KPI you set needs to provide greater insights into your campaign’s performance and highlight those aspects of it that need to be improved.
Most importantly, Google Analytics metrics constantly intertwine. Just look at the above-mentioned examples. For example, if your bounce rates are high, then you cannot have positive pages per visit. On the other hand, exceptional average session duration means nothing if your customers don’t convert in the end, right?
This is why you need to go beyond simple metric measurements and always put them in a broader context.
3 Comments
Josh
2019-03-28 at 17:08Great article and the data points used for averages are in line with where I like to see my clients. In most situations, I’d recommend exit rate over pages per page though, unless you’re operating an article-based site. Exit rate will tell you a lot about your site’s structure, CTA effectiveness, and how users are going through your site. Exit rate is a great way to tell if your conversion pages are effective.
Robert
2019-04-05 at 14:22Good point you have there Josh. I wouldn’t replace Pages per visit though, instead, I can see the Exit rate as the fifth metric in this article! 🙂 Especially with having the Bounce rate around.